Introduction
This chapter describes the three debugging modes supported by the development board.
GDB Debug
Run on the host directly and communicate with the target device via GDB Server.
Support using the
.axffile to set breakpoints at the corresponding source code locations.
Jlink Debug
Support halting the CPU and obtaining the current CPU status directly.
Allow direct access to the target device’s memory.
Ozone Debug
Provide graphical user interface debugging operations.
Hardware Connection
Refer to the following diagram to connect JLink’s SWCLK and SWDIO to the SoC’s SWD CLK and SWD DATA, then connect JLink to the PC.

Wiring diagram of connecting JLink to SWD
Note
The JLink version must be v9 or higher.
GDB Debug
GDB Software Connect and Configure
Download and install the latest GDB Server from SEGGER official website
Edit the corresponding
xxx_jlinkGDBSever.batto adjust the path of JLinkGDBServer.exe
Connect JLinkGDBSever
Double-click {SDK}\amebadplus_gcc_project\utils\jlink_script\cm4_jlinkGDBSever.bat. As shown below, confirm successful connection between KM4 and JLinkGDBSever:
Caution
Keep this window open for subsequent operations
Connect JLinkGDBSever
Double-click {SDK}\amebadplus_gcc_project\utils\jlink_script\cm0_jlinkGDBSever.bat. As shown below, confirm successful connection between KM0 and JLinkGDBSever:
Connect JLinkGDBSever
Double-click {SDK}\amebalite_gcc_project\utils\jlink_script\km4_jlinkGDBSever_combination.bat. Confirm KM4 and JLinkGDBSever connection as shown:
Caution
Keep this window open for KM4 subsequent operations
Connect JLinkGDBSever
KM4 uses SWD and KR4 uses Cjtag in the system. In EVB, both share the same set of Debug pins. Since the default working mode is SWD, if switch to Cjtag mode, you need to connect KM4 via SWD and configure the internal circuit working state.
Close KM4 JLinkGDBSever connection
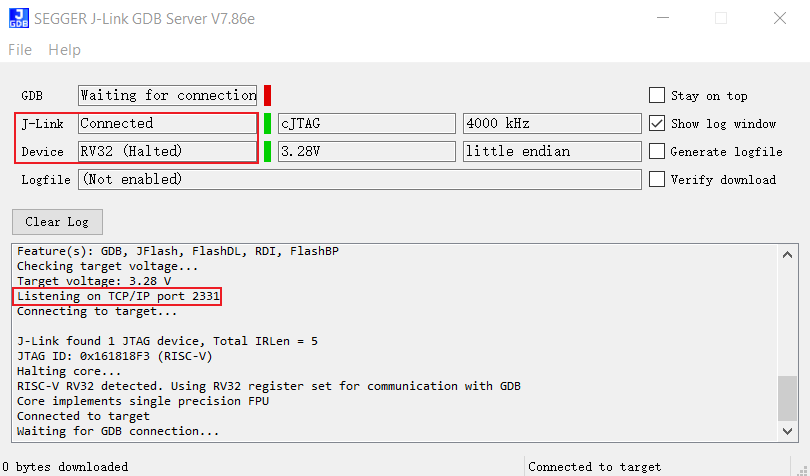
Double-click {SDK}\amebalite_gcc_project\utils\jlink_script\kr4_jlinkGDBSever_combination.bat. Confirm KR4 and JLinkGDBSever connection as shown:
Caution
Keep this window open for KR4 subsequent operations
Connect JLinkGDBSever
Double-click {SDK}\amebalite_gcc_project\utils\jlink_script\km4_jlinkGDBSever_combination.bat. Confirm KM4 and JLinkGDBSever connection as shown:
Caution
Keep this window open for KM4 subsequent operations
Connect JLinkGDBSever
KM4 uses SWD and KR4 uses Cjtag in the system. In EVB, both share the same set of Debug pins. Since the default working mode is SWD, if switch to Cjtag mode, you need to connect KM4 via SWD and configure the internal circuit working state.
Close KM4 JLinkGDBSever connection
Double-click {SDK}\amebalite_gcc_project\utils\jlink_script\kr4_jlinkGDBSever_combination.bat. Confirm KR4 and JLinkGDBSever connection as shown:
Caution
Keep this window open for KR4 subsequent operations
Connect JLinkGDBSever
Double-click {SDK}\amebasmart_gcc_project\utils\jlink_script\ca32_jlinkGDBSever_core0.bat. As shown below, confirm successful connection between ca32_Core0 and JLinkGDBSever:
Connect JLinkGDBSever
Double-click {SDK}\amebasmart_gcc_project\utils\jlink_script\ca32_jlinkGDBSever_core1.bat. As shown below, confirm successful connection between ca32_Core1 and JLinkGDBSever:
Connect JLinkGDBSever
Double-click {SDK}\amebasmart_gcc_project\utils\jlink_script\cm4_jlinkGDBSever.bat. As shown below, confirm successful connection between KM4 and JLinkGDBSever:
Caution
Keep this window open for subsequent operations
Connect JLinkGDBSever
Double-click {SDK}\amebasmart_gcc_project\utils\jlink_script\cm0_jlinkGDBSever.bat. As shown below, confirm successful connection between KR4 and JLinkGDBSever:
Connect JLinkGDBSever
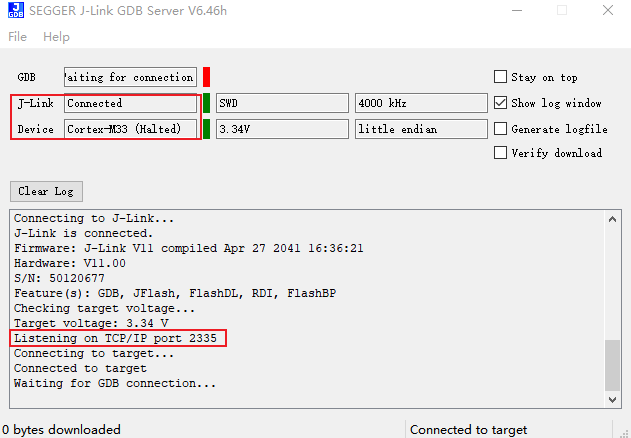
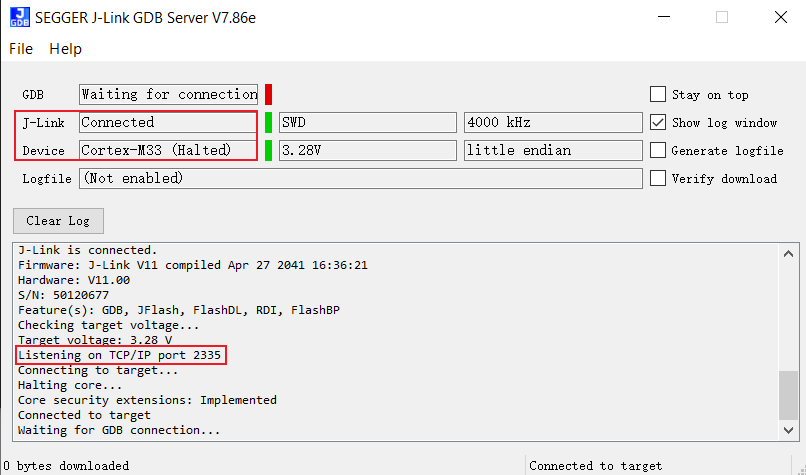
Double-click {SDK}\amebagreen2_gcc_project\utils\jlink_script\ap_jlinkGDBSever.bat. As shown below, confirm successful connection between KM4TZ and JLinkGDBSever:
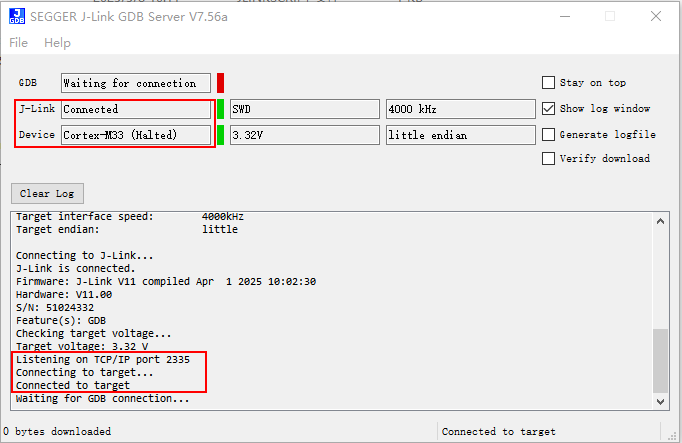
Caution
Keep this window open for subsequent operations
Connect JLinkGDBSever
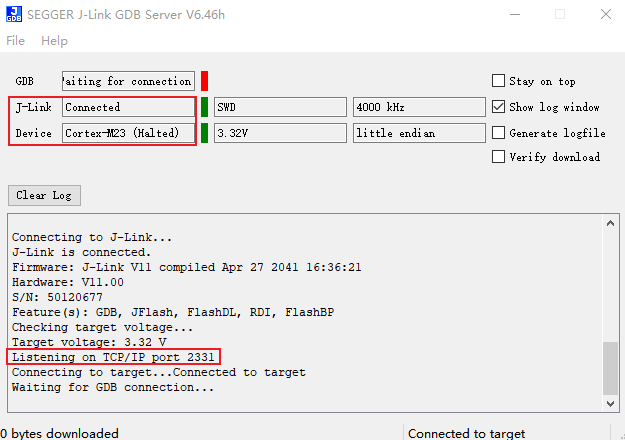
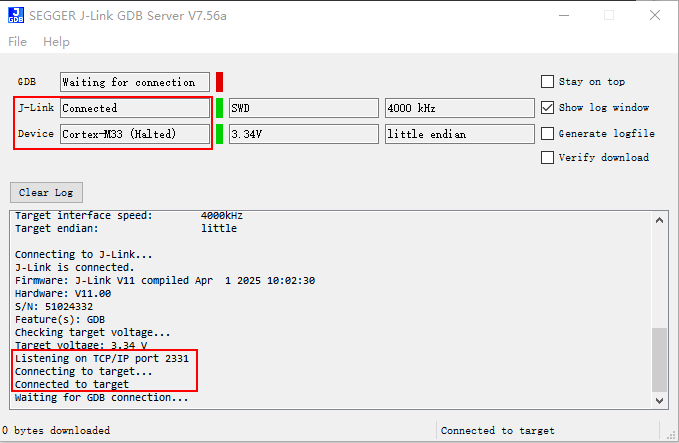
Double-click {SDK}\amebagreen2_gcc_project\utils\jlink_script\np_jlinkGDBSever.bat. As shown below, confirm successful connection between KM4NS and JLinkGDBSever:
Deploy GDB Server with these steps:
Download latest JLink package
Execute installation command:
$ dpkg -i JLink_Linux_V840_x86_64.deb
Edit the corresponding
xxx_jlinkGDBSever.batto adjust the path of JLinkGDBServer.exe
Connect JLinkGDBSever
Run
/amebadplus_gcc_project/utils/jlink_script/cm4_jlinkGDBSever.sh. As shown below, confirm successful connection between KM4 and JLinkGDBSever:------J-Link related settings------ J-Link Host interface: USB J-Link script: AP2_KM4.JLinkScript J-Link settings file: none ------Target related settings------ Target device: Cortex-M33 Target interface: SWD Target interface speed: 4000kHz Target endian: little Connecting to J-Link... J-Link is connected. Firmware: J-Link V11 compiled May 23 2023 14:44:38 Hardware: V11.00 S/N: 601015439 Feature(s): RDI, FlashBP, FlashDL, JFlash, GDB Checking target voltage... Target voltage: 3.35 V Listening on TCP/IP port 2335 Connecting to target... Connected to target Connecting for GDB connection... Waiting for GDB connection...
Caution
Keep this window open for subsequent operations
Connect JLinkGDBSever
Run
/amebadplus_gcc_project/utils/jlink_script/cm0_jlinkGDBSever.sh. As shown below, confirm successful connection between KM0 and JLinkGDBSever:------J-Link related settings------ J-Link Host interface: USB J-Link script: API_KM0.JLinkScript J-Link settings file: none ------Target related settings------ Target device: Cortex-M23 Target interface: SWD Target interface speed: 4000kHz Target endian: little Connecting to J-Link... J-Link is connected. Firmware: J-Link V11 compiled May 23 2023 14:44:38 Hardware: V11.00 S/N: 601015439 Feature(s): RDI, FlashBP, FlashDL, JFlash, GDB Checking target voltage... Target voltage: 3.35 V Listening on TCP/IP port 2331 Connecting to target... Connected to target Waiting for GDB connection...
Connect JLinkGDBSever
Run
/amebalite_gcc_project/utils/jlink_script/km4_jlinkGDBSever.sh. As shown below, confirm successful connection between KM4 and JLinkGDBSever:------J-Link related settings------ J-Link Host interface: USB J-Link script: AP0_KM4.JLinkScript J-Link settings file: none ------Target related settings------ Target device: Cortex-M33 Target interface: SWD Target interface speed: 4000kHz Target endian: little Connecting to J-Link... J-Link is connected. Firmware: J-Link V11 compiled Apr 27 2041 16:36:21 Hardware: V11.00 S/N: 50120677 Feature(s): GDB, JFlash, FlashDL, RDI, FlashBP Checking target voltage... Target voltage: 3.32 V Listening on TCP/IP port 2335 Connecting to target... Connected to target Waiting for GDB connection...
Caution
Keep this window open for KM4 subsequent operations
Connect JLinkGDBSever
KM4 uses SWD and KR4 uses Cjtag in the system. In EVB, both share the same set of Debug pins. Since the default working mode is SWD, if switch to Cjtag mode, you need to connect KM4 via SWD and configure the internal circuit working state.
Run
/amebalite_gcc_project/utils/jlink_script/kr4_jlinkGDBSever.sh. As shown below, confirm successful connection between KR4 and JLinkGDBSever:Note: Keep this terminal open for KR4 debugging (KM4 terminal should be closed)
------Target related settings------
Target device:                     RV32
Target interface:                  cJTAG
Target interface speed:            4000kHz
Target endian:                     little

Connecting to J-Link...
J-Link is connected.
Firmware: J-Link V11 compiled Apr 27 2041 16:36:21
Hardware: V11.00
S/N: 50120677
Feature(s): GDB, JFlash, FlashDL, RDI, FlashBP
Checking target voltage...
Target voltage: 3.32 V
Listening on TCP/IP port 2331
Connecting to target...

J-Link found 1 JTAG device, Total IRLen = 5
JTAG ID: 0x161818F3 (RISC-V)
Connected to target
Waiting for GDB connection...
Caution
Keep this window open for KR4 subsequent operations
Connect JLinkGDBSever
Run
/amebalite_gcc_project/utils/jlink_script/km4_jlinkGDBSever.sh. As shown below, confirm successful connection between KM4 and JLinkGDBSever:------J-Link related settings------ J-Link Host interface: USB J-Link script: AP0_KM4.JLinkScript J-Link settings file: none ------Target related settings------ Target device: Cortex-M33 Target interface: SWD Target interface speed: 4000kHz Target endian: little Connecting to J-Link... J-Link is connected. Firmware: J-Link V11 compiled Apr 27 2041 16:36:21 Hardware: V11.00 S/N: 50120677 Feature(s): GDB, JFlash, FlashDL, RDI, FlashBP Checking target voltage... Target voltage: 3.32 V Listening on TCP/IP port 2335 Connecting to target... Connected to target Waiting for GDB connection...
Caution
Keep this window open for KM4 subsequent operations
Connect JLinkGDBSever
KM4 uses SWD and KR4 uses Cjtag in the system. In EVB, both share the same set of Debug pins. Since the default working mode is SWD, if switch to Cjtag mode, you need to connect KM4 via SWD and configure the internal circuit working state.
Run
/amebalite_gcc_project/utils/jlink_script/kr4_jlinkGDBSever.sh. As shown below, confirm successful connection between KR4 and JLinkGDBSever:Note: Keep this terminal open for KR4 debugging (KM4 terminal should be closed)
------Target related settings------
Target device:                     RV32
Target interface:                  cJTAG
Target interface speed:            4000kHz
Target endian:                     little

Connecting to J-Link...
J-Link is connected.
Firmware: J-Link V11 compiled Apr 27 2041 16:36:21
Hardware: V11.00
S/N: 50120677
Feature(s): GDB, JFlash, FlashDL, RDI, FlashBP
Checking target voltage...
Target voltage: 3.32 V
Listening on TCP/IP port 2331
Connecting to target...

J-Link found 1 JTAG device, Total IRLen = 5
JTAG ID: 0x161818F3 (RISC-V)
Connected to target
Waiting for GDB connection...
Caution
Keep this window open for KR4 subsequent operations
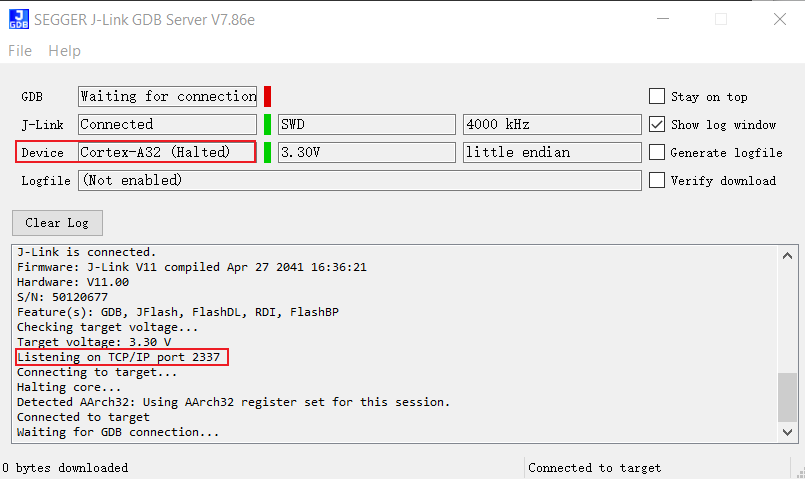
Run
/amebasmart_gcc_project/utils/jlink_script/ca32_jlink_core0.sh. As shown below, confirm successful connection between ca32_Core0 and JLinkGDBSever:
Connect JLinkGDBSever
-----GDB Server start settings-----
GDBInit file:                 none
GDB Server Listening port:    2337
SWO raw output listening port:2332
Terminal I/O port:            2333
Accept remote connection:     yes
Generate logfile:             off
Verify download:              off
Init regs on start:           off
Silent mode:                  off
Single run mode:              off
Target connection timeout:    0 ms
------J-Link related settings------
J-Link Host interface:        USB
J-Link script:                AP3_CA32_Core0.JLinkScript
J-Link settings file:         none
------Target related settings------
Target device:                cortex-a32
Target interface:             SWD
Target interface speed:       4000kHz
Target endian:                little

Connecting to J-Link...
J-Link is connected.
Firmware: J-Link V11 compiled Apr 27 2041 16:36:21
Hardware: V11.00
S/N: 50120677
Feature(s): GDB, JFlash, FlashDL, RDI, FlashBP
Checking target voltage...
Target voltage: 3.40 V
Listening on TCP/IP port 2337
Connecting to target...
Connected to target
Waiting for GDB connection...
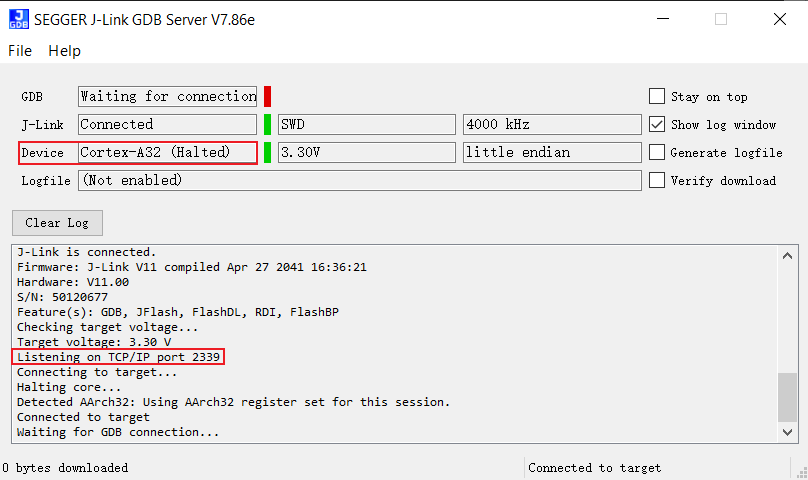
Connect JLinkGDBSever
Run
/amebasmart_gcc_project/utils/jlink_script/ca32_jlink_core1.sh. As shown below, confirm successful connection between ca32_Core1 and JLinkGDBSever:
-----GDB Server start settings-----
GDBInit file:                 none
GDB Server Listening port:    2339
SWO raw output listening port:2332
Terminal I/O port:            2333
Accept remote connection:     yes
Generate logfile:             off
Verify download:              off
Init regs on start:           off
Silent mode:                  off
Single run mode:              off
Target connection timeout:    0 ms
------J-Link related settings------
J-Link Host interface:        USB
J-Link script:                AP3_CA32_Core1.JLinkScript
J-Link settings file:         none
------Target related settings------
Target device:                cortex-a32
Target interface:             SWD
Target interface speed:       4000kHz
Target endian:                little

Connecting to J-Link...
J-Link is connected.
Firmware: J-Link V11 compiled Apr 27 2041 16:36:21
Hardware: V11.00
S/N: 50120677
Feature(s): GDB, JFlash, FlashDL, RDI, FlashBP
Checking target voltage...
Target voltage: 3.40 V
Listening on TCP/IP port 2339
Connecting to target...
Connected to target
Waiting for GDB connection...
Connect JLinkGDBSever
Run
/amebasmart_gcc_project/utils/jlink_script/cm4_jlink.sh. As shown below, confirm successful connection between km4 and JLinkGDBSever:
-----GDB Server start settings-----
GDBInit file:                 none
GDB Server Listening port:    2335
SWO raw output listening port:2332
Terminal I/O port:            2333
Accept remote connection:     yes
Generate logfile:             off
Verify download:              off
Init regs on start:           off
Silent mode:                  off
Single run mode:              off
Target connection timeout:    0 ms
------J-Link related settings------
J-Link Host interface:        USB
J-Link script:                AP1_KM4.JLinkScript
J-Link settings file:         none
------Target related settings------
Target device:                cortex-m33
Target interface:             SWD
Target interface speed:       4000kHz
Target endian:                little

Connecting to J-Link...
J-Link is connected.
Firmware: J-Link V11 compiled Apr 27 2041 16:36:21
Hardware: V11.00
S/N: 50120677
Feature(s): GDB, JFlash, FlashDL, RDI, FlashBP
Checking target voltage...
Target voltage: 3.40 V
Listening on TCP/IP port 2335
Connecting to target...
Connected to target
Waiting for GDB connection...
Caution
Keep this window open for subsequent operations
Connect JLinkGDBSever
Run
/amebasmart_gcc_project/utils/jlink_script/cm4_jlink.sh. As shown below, confirm successful connection between km0 and JLinkGDBSever:
-----GDB Server start settings-----
GDBInit file:                  none
GDB Server listening port:     2331
SWO raw output listening port: 2332
Terminal I/O port:             2333
Accept remote connection:      off
Generate logfile:              off
Verify download:               off
Init regs on start:            off
Silent mode:                   off
Single run mode:               off
Target connection timeout:     0 ms
------J-Link related settings------
J-Link Host interface:         USB
J-Link script:                 AP0_KM0.JLinkScript
J-Link settings file:          none
------Target related settings------
Target device:                 cortex-m23
Target interface:              SWD
Target interface speed:        4000kHz
Target endian:                 little

Connecting to J-Link...
J-Link is connected.
Firmware: J-Link V11 compiled Apr 27 2041 16:36:21
Hardware: V11.00
S/N: 50120677
Feature(s): GDB, JFlash, FlashDL, RDI, FlashBP
Checking target voltage...
Target voltage: 3.40 V
Listening on TCP/IP port 2331
Connecting to target...
Connected to target
Waiting for GDB connection...
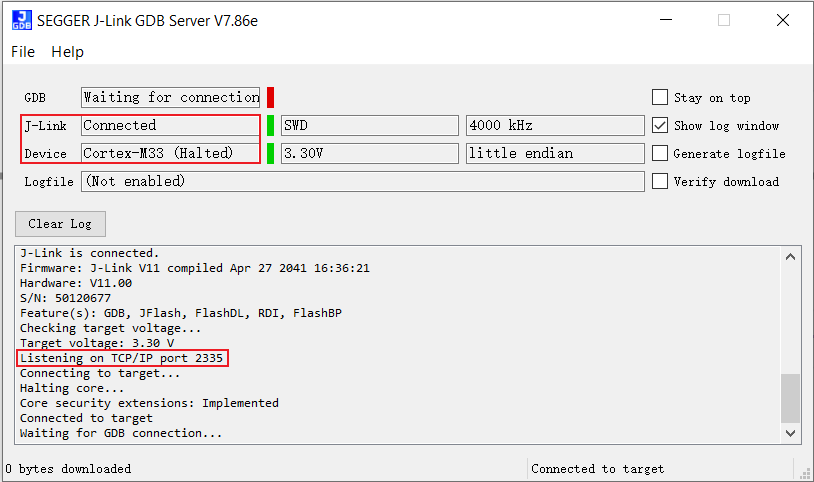
连接 JLinkGDBSever
运行
/amebagreen2_gcc_project/utils/jlink_script/ap_jlinkGDBSever.sh,如下所示,确认 KM4TZ 与 JLinkGDBSever 成功连接。------J-Link related settings------ J-Link Host interface: USB J-Link script: AP2_AP.JLinkScript J-Link settings file: none ------Target related settings------ Target device: Cortex-M33 Target device parameters: none Target interface: SWD Target interface speed: 4000kHz Target endian: little Connecting to J-Link... J-Link is connected. Firmware: J-Link V11 compiled Apr 1 2025 10:02:30 Hardware: V11.00 S/N: 51024332 Feature(s): GDB Checking target voltage... Target voltage: 3.34 V Listening on TCP/IP port 2335 Connecting to target... Halting core... Core security extensions: Implemented Connected to target Waiting for GDB connection...
Caution
保持此窗口开启以进行后续操作
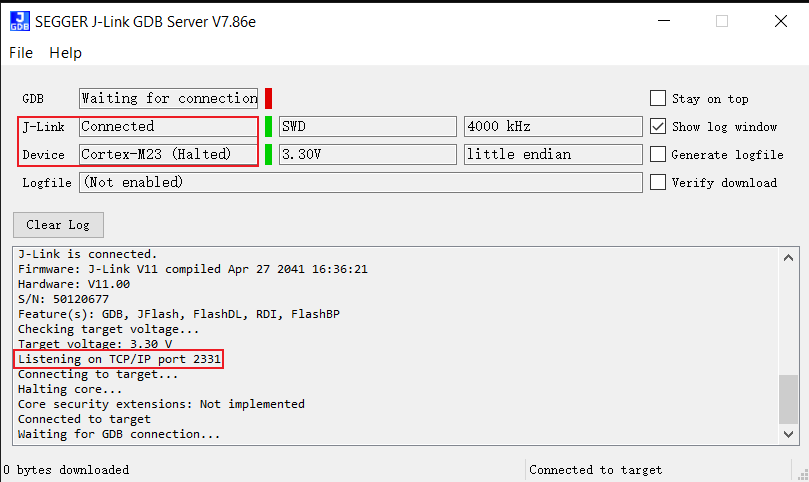
连接 JLinkGDBSever
运行
/amebagreen2_gcc_project/utils/jlink_script/np_jlinkGDBSever.sh,如下所示,确认 KM4NS 与 JLinkGDBSever 成功连接。------J-Link related settings------ J-Link Host interface: USB J-Link script: AP1_NP.JLinkScript J-Link settings file: none ------Target related settings------ Target device: Cortex-M33 Target device parameters: none Target interface: SWD Target interface speed: 4000kHz Target endian: little Connecting to J-Link... J-Link is connected. Firmware: J-Link V11 compiled Apr 1 2025 10:02:30 Hardware: V11.00 S/N: 51024332 Feature(s): GDB Checking target voltage... Target voltage: 3.34 V Listening on TCP/IP port 2331 Connecting to target... Halting core... Core security extensions: Not implemented Connected to target Waiting for GDB connection...
GDB Download Image
We recommend using Realtek’s Image Tool software for firmware download. For more information, please refer to Image Tool.
If you must use JLinkGDBSever to download the firmware, please follow the instructions below:
Compile the image (refer to Building Code) and connect JLink
Enter the
build.py -gdbcommand to start the download. The firmware will be downloaded to Flash, and take RTL8721Dx as an example, as shown below:Breakpoint 1, Gdb_Floader_Program_Start () at .amebadplus_gcc_project/project_km4/asdk/flashloader/rtl_flash_download.c:36 36 in .amebadplus_gcc_project/project_km4/asdk/flashloader/rtl_flash_download.c flash_write FileName:3 flash_write FileSize:0 Loopnumber = 0 TailSize = 0 global variables FlashDatSrc:3000a754 FlashBlockWriteSize:800 Flash write start... Breakpoint 2, Gdb_Floader_Program_End () at .amebadplus_gcc_project/project_km4/asdk/flashloader/rtl_flash_download.c:45 45 in .amebadplus_gcc_project/project_km4/asdk/flashloader/rtl_flash_download.c dump for check
Confirm the firmware
select verify download before downloading. During the firmware download, there will be a verified OK log prompt.
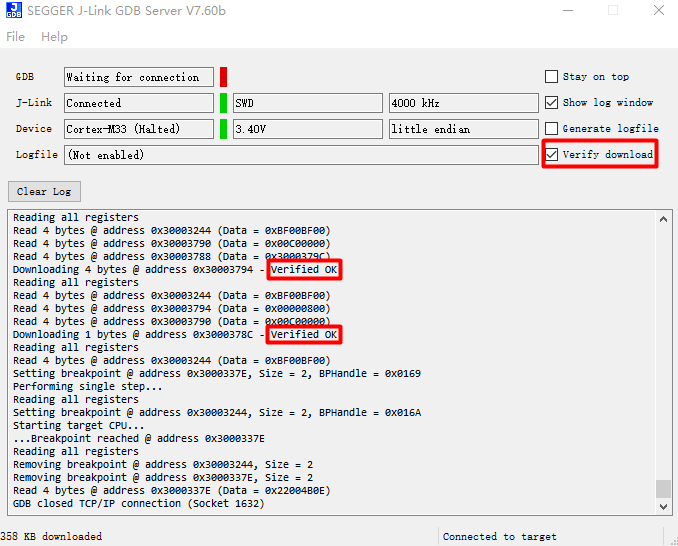
Check the GDBSever connection window to confirm the download progress.
Starting target CPU...
...Breakpoint (set by 'GDB') reached @ address 0x3000A304
Reading common registers: Read register 'r0' (4 bytes) from hardware: 0x14000000
Read register 'r1' (4 bytes) from hardware: 0x0002FF00
Read register 'r2' (4 bytes) from hardware: 0x9C0DF100
Read register 'r3' (4 bytes) from hardware: 0x900F0030
Read register 'r4' (4 bytes) from hardware: 0x00000000
Read register 'r5' (4 bytes) from hardware: 0xFFFFFFFF
Read register 'r6' (4 bytes) from hardware: 0x19E0FF00
Read register 'r7' (4 bytes) from hardware: 0x19E0FF00
Read register 'r8' (4 bytes) from hardware: 0x00000000
Read register 'r9' (4 bytes) from hardware: 0x00000000
Read register 'r10' (4 bytes) from hardware: 0x00000018
Read register 'r11' (4 bytes) from hardware: 0x00000000
Read register 'r12' (4 bytes) from hardware: 0x00000000
Read register 'sp' (4 bytes) from hardware: 0x93A2E030
Read register 'lr' (4 bytes) from hardware: 0x9C0DF030
Read register 'pc' (4 bytes) from hardware: 0x04A30030
Read register 'xpsr' (4 bytes) from hardware: 0x01000061
Removing breakpoint @ address 0x3000A2EC, Size = 2
Removing breakpoint @ address 0x3000A304, Size = 2
Read 4 bytes @ address 0x3000A304 (Data = 0x21004A03)
GDB closed TCP/IP connection (Socket 10)
After the download is complete, press the
Resetbutton to see the device boot with the new firmware.
Debug Mode Entry Process
Build Image and Connect JLinkGDBSever
Execute Debug Commands
Navigate to SDK root directory
Run
build.py -debugto enter GDB mode, take RTL8721Dx as an example, as shown below:
GDB CMD :  cd E:\sdk0508\amebadplus_gcc_project\project_km4/asdk && C:/rtk-toolchain/asdk-10.3.1-4365/mingw32/newlib/bin/arm-none-eabi-gdb.exe -x E:\sdk0508\amebadplus_gcc_project\project_km4/asdk\gnu_utility/gnu_script\rtl_gdb_debug.txt
GNU gdb (Realtek ASDK-10.3.1 Build 4365) 12.1.90.20221114-git
Copyright (C) 2022 Free Software Foundation, Inc.
License GPLv3+: GNU GPL version 3 or later <http://gnu.org/licenses/gpl.html>
This is free software: you are free to change and redistribute it.
There is NO WARRANTY, to the extent permitted by law.
Type "show copying" and "show warranty" for details.
This GDB was configured as "--host=x86_64-w64-mingw32 --target=arm-none-eabi".
Type "show configuration" for configuration details.
For bug reporting instructions, please see:
<https://www.gnu.org/software/gdb/bugs/>.
Find the GDB manual and other documentation resources online at:
   <http://www.gnu.org/software/gdb/documentation/>.

For help, type "help".
Type "apropos word" to search for commands related to "word".
warning: No executable has been specified and target does not support
determining executable automatically.  Try using the "file" command.
0x3000a304 in ?? ()
Notification of completion for asynchronous execution commands is off.
(gdb)
GDB Debugger Guide
GNU Debugger enables runtime state inspection and error tracing (Reference: Debug Mode Entry Process)
Complete documentation: GDB User Manual
Function Module |
Command |
Operation Guide |
|---|---|---|
Breakpoint Management |
break (b) |
Set execution pause points |
Data Watchpoints |
watch |
Monitor variable changes (watch/rwatch/awatch) |
Breakpoint List |
info |
Display active breakpoints/watchpoints |
Breakpoint Removal |
delete (d) |
Remove specified breakpoint |
Execution Resume |
continue (c) |
Continue program execution |
Step Into |
step (s) |
Enter function execution |
Step Over |
next (n) |
Execute current line and jump to next |
Debug Session Exit |
quit (q) |
Terminate debugging session |
Call Trace |
backtrace (bt) |
Display function call stack |
Source Code View |
list (l) |
Display contextual code |
Data Inspection |
print (p) |
Output variable/expression values |
Note
Recommended watch scope <20 bytes.
JLink Debug
JLink Connect and Configure
Download and install the latest JLink from SEGGER official website
Edit the corresponding
xxx_jlink.batto adjust the path of JLink.exe
Connect JLink
Double-click {SDK}\amebadplus_gcc_project\utils\jlink_script\cm4_jlink.bat. Follow the prompts to enter connect and Enter (default value). As shown below, confirm successful connection between KM4 and JLink:
Type "connect" to establish a target connection, '?' for help
J-Link>connect
Specify target interface speed [kHz]. <Default>: 4000 kHz
Speed>
Device "CORTEX-M33" selected.

Connecting to target via SWD
InitTarget() start
InitTarget() end
Found SW-DP with ID 0x6BA02477
DPIDR: 0x6BA02477
AP map detection skipped. Manually configured AP map found.
AP[0]: APB-AP (IDR: Not set)
AP[1]: AHB-AP (IDR: Not set)
AP[2]: AHB-AP (IDR: Not set)
AP[2]: Core found
AP[2]: AHB-AP ROM base: 0xE00FF000
CPUID register: 0x721FD22A. Implementer code: 0x72 (Realtek)
Feature set: Mainline
Found Cortex-M33 r1p10, Little endian.
FPUnit: 4 code (BP) slots and 0 literal slots
Security extension: implemented
Secure debug: enabled
CoreSight components:
ROMTbl[0] @ E00FF000
[0][0]: E000E000 CID B105900D PID 000F9133 DEVARCH 47702A04 DEVTYPE 00 SCS
[0][1]: E0001000 CID B105900D PID 000F9035 DEVARCH 47701A02 DEVTYPE 00 DWT
[0][2]: E0002000 CID B105900D PID 000F9034 DEVARCH 47701A03 DEVTYPE 00 FPB
Cortex-M33 identified.
Connect JLink
Double-click {SDK}\amebadplus_gcc_project\utils\jlink_script\cm0_jlink.bat. Follow the prompts to enter connect and Enter (default value). As shown below, confirm successful connection between KM0 and JLink:
Type "connect" to establish a target connection, '?' for help
J-Link>connect
Specify target interface speed [kHz]. <Default>: 4000 kHz
Speed>
Device "CORTEX-M23" selected.

Connecting to target via SWD
InitTarget() start
******************************************************
J-Link script: AmebaDplus KM0 J-Link script
******************************************************
InitTarget() end
Found SW-DP with ID 0x6BA02477
DPIDR: 0x6BA02477
AP map detection skipped. Manually configured AP map found.
AP[0]: APB-AP (IDR: Not set)
AP[1]: AHB-AP (IDR: Not set)
AP[2]: AHB-AP (IDR: Not set)
AP[1]: Core found
AP[1]: AHB-AP ROM base: 0xE00FF000
CPUID register: 0x721CD20A. Implementer code: 0x72 (Realtek)
Feature set: Baseline
Found Cortex-M23 r1p10, Little endian.
FPUnit: 4 code (BP) slots and 0 literal slots
Security extension: not implemented
CoreSight components:
ROMTbl[0] @ E00FF000
[0][0]: E000E000 CID B105900D PID 000F9013 DEVARCH 47702A04 DEVTYPE 00 SCS
[0][1]: E0001000 CID B105900D PID 000F9015 DEVARCH 47701A02 DEVTYPE 00 DWT
[0][2]: E0002000 CID B105900D PID 000F9014 DEVARCH 47701A03 DEVTYPE 00 FPB
Cortex-M23 identified.
Connect JLink
Double-click {SDK}\amebalite_gcc_project\utils\jlink_script\km4_jlink_combination.bat. Follow the prompts to enter connect and Enter (default value). Confirm KM4-JLink connection as shown:
Type "connect" to establish a target connection, '?' for help
J-Link>connect
Specify target interface speed [kHz]. <Default>: 4000 kHz
Speed>
Device "CORTEX-M33" selected.

Connecting to target via SWD
InitTarget() start
InitTarget() end
Found SW-DP with ID 0x6BA02477
DPIDR: 0x6BA02477
AP map detection skipped. Manually configured AP map found.
AP[0]: AHB-AP (IDR: Not set)
AP[1]: AHB-AP (IDR: Not set)
AP[2]: AHB-AP (IDR: Not set)
AP[3]: APB-AP (IDR: Not set)
AP[0]: Core found
AP[0]: AHB-AP ROM base: 0xE00FF000
CPUID register: 0x721FD228. Implementer code: 0x72 (Realtek)
Feature set: Mainline
Found Cortex-M33 r1p8, Little endian.
FPUnit: 8 code (BP) slots and 0 literal slots
Security extension: implemented
Secure debug: enabled
CoreSight components:
ROMTbl[0] @ E00FF000
[0][0]: E000E000 CID B105900D PID 000F9133 DEVARCH 47702A04 DEVTYPE 00 SCS
[0][1]: E0001000 CID B105900D PID 000F9035 DEVARCH 47701A02 DEVTYPE 00 DWT
[0][2]: E0002000 CID B105900D PID 000F9034 DEVARCH 47701A03 DEVTYPE 00 FPB
Cortex-M33 identified.
Connect JLink
Double-click {SDK}\amebalite_gcc_project\utils\jlink_script\kr4_jlink_combination.bat. Follow the prompts to enter connect and Enter (default value). Confirm KR4-JLink connection as shown:
Type "connect" to establish a target connection, '?' for help
J-Link>connect
Device position in JTAG chain (IRPre,DRPre) <Default>: -1,-1 => Auto-detect
JTAGConf>
Specify target interface speed [kHz]. <Default>: 4000 kHz
Speed>
Device "RV32" selected.

Connecting to target via cJTAG
ConfigTargetSettings() start
ConfigTargetSettings() end
TotalIRLen = 5, IRPrint = 0x01
JTAG chain detection found 1 devices:
#0 Id: 0x161818F3, IRLen: 05, Unknown device
Debug architecture:
RISC-V debug: 0.13
AddrBits: 8
DataBits: 32
IdleClks: 7
Memory access:
Via system bus: No
Via ProgBuf: Yes (2 ProgBuf entries)
Via abstract command (AAM): May be tried as last resort
DataBuf: 2 entries
autoexec[0] implemented: Yes
Detected: RV32 core
CSR access via abs. commands: No
Temp. halted CPU for NumHWBP detection
HW instruction/data BPs: 8
Support set/clr BPs while running: No
HW data BPs trigger after execution of inst
BG memory access support: No
RISC-V identified.
Connect JLink
Double-click
{SDK}\amebasmart_gcc_project\utils\jlink_script\ca32_jlink_core0.bat. Follow the prompts to enter connect and Enter (default value). Confirm Core0-JLink connection as shown:Type "connect" to establish a target connection, '?' for help J-Link>connect Specify target interface speed [kHz]. <Default>: 4000 kHz Speed> Device "CORTEX-A32" selected. Connecting to target via SWD InitTarget() start ****************************************************** J-Link script: AmebaSmart (Cortex-A32 CPU0) J-Link script ****************************************************** ****************************************************** J-Link script: ResetTarget() ****************************************************** EDPRSR: 0x0000000B InitTarget() end Found SW-DP with ID 0x6BA02477 Skipped AP map detection. User manually configured AP map Skipped APB-AP search. User manually configured AP[3] as debug ABP-AP AP[0]: AHB-AP AP[1]: AHB-AP AP[2]: AHB-AP AP[3]: APB-AP ROM table scan skipped because DebugRegs and CTI addr. are manually specified Cortex-A32 @ 0x80030000 (configured) CoreCTI @ 0x80038000 (configured) Debug architecture: ARMv8 6 code breakpoints, 4 data breakpoints Processor features: EL0 support: AArch32 EL1 support: AArch32 EL2 support: N/A EL3 support: N/A FPU support: Single + Double + Conversion Add. info (CPU temp. halted) Current exception level: EL1 Exception level AArch usage: EL0: AArch32 EL1: AArch32 EL2: AArch32 EL3: AArch32 Non-secure status: Non-secure Cache info: Inner cache boundary: none LoU Uniprocessor: 1 LoC: 2 LoU Inner Shareable: 1 I-Cache L1: 32 KB, 256 Sets, 64 Bytes/Line, 2-Way D-Cache L1: 32 KB, 128 Sets, 64 Bytes/Line, 4-Way Unified-Cache L2: 256 KB, 512 Sets, 64 Bytes/Line, 8-Way Cortex-A32 identified.
Connect JLink
Double-click
{SDK}\amebasmart_gcc_project\utils\jlink_script\ca32_jlink_core1.bat. Follow the prompts to enter connect and Enter (default value). Confirm Core1-JLink connection as shown:Type "connect" to establish a target connection, '?' for help J-Link>connect Specify target interface speed [kHz]. <Default>: 4000 kHz Speed> Device "CORTEX-A32" selected. Connecting to target via SWD InitTarget() start ****************************************************** J-Link script: AmebaSmart (Cortex-A32 CPU0) J-Link script ****************************************************** ****************************************************** J-Link script: ResetTarget() ****************************************************** EDPRSR: 0x0000000B InitTarget() end Found SW-DP with ID 0x6BA02477 Skipped AP map detection. User manually configured AP map Skipped APB-AP search. User manually configured AP[3] as debug ABP-AP AP[0]: AHB-AP AP[1]: AHB-AP AP[2]: AHB-AP AP[3]: APB-AP ROM table scan skipped because DebugRegs and CTI addr. are manually specified Cortex-A32 @ 0x80032000 (configured) CoreCTI @ 0x80039000 (configured) Debug architecture: ARMv8 6 code breakpoints, 4 data breakpoints Processor features: EL0 support: AArch32 EL1 support: AArch32 EL2 support: N/A EL3 support: N/A FPU support: Single + Double + Conversion Add. info (CPU temp. halted) Current exception level: EL1 Exception level AArch usage: EL0: AArch32 EL1: AArch32 EL2: AArch32 EL3: AArch32 Non-secure status: Non-secure Cache info: Inner cache boundary: none LoU Uniprocessor: 1 LoC: 2 LoU Inner Shareable: 1 I-Cache L1: 32 KB, 256 Sets, 64 Bytes/Line, 2-Way D-Cache L1: 32 KB, 128 Sets, 64 Bytes/Line, 4-Way Unified-Cache L2: 256 KB, 512 Sets, 64 Bytes/Line, 8-Way Cortex-A32 identified.
Connect JLink
Double-click {SDK}\amebasmart_gcc_project\utils\jlink_script\cm4_jlink.bat. Follow the prompts to enter connect and Enter (default value). Confirm KM4-JLink connection as shown:
Type "connect" to establish a target connection, '?' for help
J-Link>connect
Specify target interface speed [kHz]. <Default>: 4000 kHz
Speed>
Device "CORTEX-M33" selected.

Connecting to target via SWD
InitTarget() start
InitTarget() end
Found SW-DP with ID 0x6BA02477
DPIDR: 0x6BA02477
AP map detection skipped. Manually configured AP map found.
AP[0]: AHB-AP (IDR: Not set)
AP[1]: AHB-AP (IDR: Not set)
AP[2]: AHB-AP (IDR: Not set)
AP[3]: APB-AP (IDR: Not set)
AP[1]: Core found
AP[1]: AHB-AP ROM base: 0xE00FF000
CPUID register: 0x721FD228. Implementer code: 0x72 (Realtek)
Feature set: Mainline
Found Cortex-M33 r1p8, Little endian.
FPUnit: 8 code (BP) slots and 0 literal slots
Security extension: implemented
Secure debug: enabled
CoreSight components:
ROMTbl[0] @ E00FF000
[0][0]: E000E000 CID B105900D PID 000F9133 DEVARCH 47702A04 DEVTYPE 00 SCS
[0][1]: E0001000 CID B105900D PID 000F9035 DEVARCH 47701A02 DEVTYPE 00 DWT
[0][2]: E0002000 CID B105900D PID 000F9034 DEVARCH 47701A03 DEVTYPE 00 FPB
Cortex-M33 identified.
Connect JLink
Double-click {SDK}\amebasmart_gcc_project\utils\jlink_script\cm0_jlink.bat. Follow the prompts to enter connect and Enter (default value). Confirm KM0-JLink connection as shown:
Type "connect" to establish a target connection, '?' for help
J-Link>connect
Specify target interface speed [kHz]. <Default>: 4000 kHz
Speed>
Device "CORTEX-M23" selected.

Connecting to target via SWD
InitTarget() start
******************************************************
J-Link script: AmebaSmart KM0 J-Link script
******************************************************
InitTarget() end
Found SW-DP with ID 0x6BA02477
DPIDR: 0x6BA02477
AP map detection skipped. Manually configured AP map found.
AP[0]: AHB-AP (IDR: Not set)
AP[1]: AHB-AP (IDR: Not set)
AP[2]: AHB-AP (IDR: Not set)
AP[3]: APB-AP (IDR: Not set)
AP[0]: Core found
AP[0]: AHB-AP ROM base: 0xE00FF000
CPUID register: 0x721CD208. Implementer code: 0x72 (Realtek)
Feature set: Baseline
Found Cortex-M23 r1p8, Little endian.
FPUnit: 8 code (BP) slots and 0 literal slots
Security extension: not implemented
CoreSight components:
ROMTbl[0] @ E00FF000
[0][0]: E000E000 CID B105900D PID 000F9013 DEVARCH 47702A04 DEVTYPE 00 SCS
[0][1]: E0001000 CID B105900D PID 000F9015 DEVARCH 47701A02 DEVTYPE 00 DWT
[0][2]: E0002000 CID B105900D PID 000F9014 DEVARCH 47701A03 DEVTYPE 00 FPB
Cortex-M23 identified.
Connect JLink
Double-click {SDK}\amebagreen2_gcc_project\utils\jlink_script\ap_jlink.bat. Follow the prompts to enter connect and Enter (default value). As shown below, confirm successful connection between AP and JLink:
Type "connect" to establish a target connection, '?' for help
J-Link>connect
Specify target interface speed [kHz]. <Default>: 4000 kHz
Speed>
Device "CORTEX-M33" selected.

Connecting to target via SWD
InitTarget() start
InitTarget() end
Found SW-DP with ID 0x6BA02477
DPIDR: 0x6BA02477
AP map detection skipped. Manually configured AP map found.
AP[0]: APB-AP (IDR: Not set)
AP[1]: AHB-AP (IDR: Not set)
AP[2]: AHB-AP (IDR: Not set)
AP[2]: Core found
AP[2]: AHB-AP ROM base: 0xE00FF000
CPUID register: 0x721FD22A. Implementer code: 0x72 (Realtek)
Feature set: Mainline
Found Cortex-M33 r1p10, Little endian.
FPUnit: 4 code (BP) slots and 0 literal slots
Security extension: implemented
Secure debug: enabled
CoreSight components:
ROMTbl[0] @ E00FF000
[0][0]: E000E000 CID B105900D PID 000F9023 DEVARCH 47702A04 DEVTYPE 00 SCS
[0][1]: E0001000 CID B105900D PID 000F9025 DEVARCH 47701A02 DEVTYPE 00 DWT
[0][2]: E0002000 CID B105900D PID 000F9024 DEVARCH 47701A03 DEVTYPE 00 FPB
Cortex-M33 identified.
Connect JLink
Double-click {SDK}\amebagreen2_gcc_project\utils\jlink_script\np_jlink.bat. Follow the prompts to enter connect and Enter (default value). As shown below, confirm successful connection between NP and JLink:
Type "connect" to establish a target connection, '?' for help
J-Link>connect
Specify target interface speed [kHz]. <Default>: 4000 kHz
Speed>
Device "CORTEX-M33" selected.

Connecting to target via SWD
InitTarget() start
******************************************************
J-Link script: AP1 J-Link script
******************************************************
InitTarget() end
Found SW-DP with ID 0x6BA02477
DPIDR: 0x6BA02477
AP map detection skipped. Manually configured AP map found.
AP[0]: APB-AP (IDR: Not set)
AP[1]: AHB-AP (IDR: Not set)
AP[2]: AHB-AP (IDR: Not set)
AP[1]: Core found
AP[1]: AHB-AP ROM base: 0xE00FF000
CPUID register: 0x721FD22A. Implementer code: 0x72 (Realtek)
Feature set: Mainline
Found Cortex-M33 r1p10, Little endian.
FPUnit: 4 code (BP) slots and 0 literal slots
Security extension: not implemented
CoreSight components:
ROMTbl[0] @ E00FF000
[0][0]: E000E000 CID B105900D PID 000F9023 DEVARCH 47702A04 DEVTYPE 00 SCS
[0][1]: E0001000 CID B105900D PID 000F9025 DEVARCH 47701A02 DEVTYPE 00 DWT
[0][2]: E0002000 CID B105900D PID 000F9024 DEVARCH 47701A03 DEVTYPE 00 FPB
Cortex-M33 identified.
Deploy JLink with these steps:
Download latest JLink package
Execute installation command:
$ dpkg -i JLink_Linux_V840_x86_64.deb
Edit the corresponding
xxx_jlink.batto adjust the path of JLink.exe
Connect JLink
Run
/amebadplus_gcc_project/utils/jlink_script/cm4_jlink.shFollow the prompts to enter connect and Enter (default value) to confirm that KM4 is successfully connected to JLink, as shown:
Type "connect" to establish a target connection, '?' for help
J-Link>connect
Specify target interface speed [kHz]. <Default>: 4000 kHz
Speed>
Device "CORTEX-M33" selected.

Connecting to target via SWD
InitTarget() start
InitTarget() end - Took 236us
Found SW-DP with ID 0x6BA02477
DPIDR: 0x6BA02477
CoreSight SoC-400 or earlier
AP map detection skipped. Manually configured AP map found.
AP[0]: APB-AP (IDR: Not set, ADDR: 0x00000000)
AP[1]: AHB-AP (IDR: Not set, ADDR: 0x00000000)
AP[2]: AHB-AP (IDR: Not set, ADDR: 0x00000000)
AP[2]: Core found
AP[2]: AHB-AP ROM base: 0xE00FF000
CPUID register: 0x721FD22A. Implementer code: 0x72 (Realtek)
Feature set: Mainline
Cache: L1 I/D-cache present
Found Cortex-M33 r1p0, Little endian.
FPU: 4 code (BP) slots and 0 literal slots
Security extension: implemented
Secure debug: enabled
CoreSight components:
ROMTbl[0] @ E00FF000
[0][0]: E000E000 CID B105900D PID 0F09D13A DEVARCH 47702A04 DEVTYPE 00 SCS
[0][1]: E0001000 CID B105900D PID 0F09D135 DEVARCH 47701A02 DEVTYPE 00 DWT
[0][2]: E0002000 CID B105900D PID 0F09D134 DEVARCH 47701A03 DEVTYPE 00 FPB
I-Cache L1: 16 KB, 128 Sets, 32 Bytes/Line, 4-Way
D-Cache L1: 16 KB, 128 Sets, 32 Bytes/Line, 4-Way
Memory zones:
Zone: "Default" Description: Default access mode
Cortex-M33 identified.
Caution
Keep this window open for subsequent operations
Connect JLink
Run
/amebadplus_gcc_project/utils/jlink_script/cm0_jlink.shFollow the prompts to enter connect and Enter (default value) to confirm that KM0 is successfully connected to JLink, as shown:
Type "connect" to establish a target connection, '?' for help
J-Link> connect
Specify target interface speed [kHz]. <Default>: 4000 kHz
Speed>
Device "CORTEX-M23" selected.

Connecting to target via SWD
InitTarget() start
***********************************************************

* J-Link script: AmebaDPlus KMO J-Link script

***********************************************************
InitTarget() end - Took 251us
Found SW-DP with ID 0x6BA02477
DPIDR: 0x6BA02477
CoreSight SoC-400 or earlier
AP map detection skipped. Manually configured AP map found.
AP[0]: APB-AP (IDR: Not set, ADDR: 0x00000000)
AP[1]: AHB-AP (IDR: Not set, ADDR: 0x00000000)
AP[2]: AHB-AP (IDR: Not set, ADDR: 0x00000000)
AP[1]: Core found
AP[1]: AHB-AP ROM base: 0xE00FF000
CPUID register: 0x721CD20A. Implementer code: 0x72 (Realtek)
Feature set: Baseline
Cache: L1 I/D-cache present
Found Cortex-M23 r1p10, Little endian.
FPUUnit: 4 code (BP) slots and 0 literal slots
Security extension: not implemented
CoreSight components:
ROMTbl[0] @ E00FF000
E00FE000: CID B105900D PID 00FF0013 DEVARCH 47702A04 DEVTYPE 00 SCS
E00FF000: CID B105900D PID 00FF0013 DEVARCH 47701A02 DEVTYPE 00 DWT
E00FC000: CID B105900D PID 00FF0013 DEVARCH 47701A03 DEVTYPE 00 FPB
I-Cache L1: 16 KB, 128 Sets, 32 Bytes/Line, 4-Way
D-Cache L1: 16 KB, 128 Sets, 32 Bytes/Line, 4-Way
Memory zones:
Zone: "Default" Description: Default access mode
Cortex-M23 identified.
Connect JLink
Run
/amebalite_gcc_project/utils/jlink_script/km4_jlink.shFollow the prompts to enter connect and Enter (default value) and confirm KM4 is successfully connected to JLink, as shown:
Type "connect" to establish a target connection, '?' for help
J-Link>connect
Specify target interface speed [kHz]. <Default>: 4000 kHz
Speed>
Device "CORTEX-M33" selected.

Connecting to target via SWD
InitTarget() start
InitTarget() end - Took 354us
Found SW-DP with ID 0x6BA02477
DPIDR: 0x6BA02477
CoreSight SoC-400 or earlier
AP map detection skipped. Manually configured AP map found.
AP[0]: AHB-AP (IDR: Not set, ADDR: 0x00000000)
AP[1]: AHB-AP (IDR: Not set, ADDR: 0x00000000)
AP[2]: AHB-AP (IDR: Not set, ADDR: 0x00000000)
AP[3]: APB-AP (IDR: Not set, ADDR: 0x00000000)
AP[0]: Core found
AP[0]: AHB-AP ROM base: 0xE00FF000
CPUID register: 0x721FD228. Implementer code: 0x72 (Realtek)
Feature set: Mainline
Cache: L1 I/D-cache present
Found Cortex-M33 r1p8, Little endian.
FPUnit: 8 code (BP) slots and 0 literal slots
Security extension: implemented
Secure debug: enabled
CoreSight components:
ROMTbl[0] @ E00FF000
[0][0]: E00FE000 CID B105900D PID 000F9133 DEVARCH 47702A04 DEVTYPE 00 SCS
[1][0]: E0001000 CID B105900D PID 000F9035 DEVARCH 47701A02 DEVTYPE 00 DWT
[2][0]: E0002000 CID B105900D PID 000F9034 DEVARCH 47701A03 DEVTYPE 00 FPB
I-Cache L1: 16 KB, 128 Sets, 32 Bytes/Line, 4-Way
D-Cache L1: 16 KB, 128 Sets, 32 Bytes/Line, 4-Way
Memory zones:
  Zone: "Default" Description: Default access mode
Cortex-M33 identified.
KM4 Connection
Run
/amebalite_gcc_project/utils/jlink_script/kr4_jlink.shNote: Keep this terminal open for KR4 debugging (KM4 terminal should be closed)
Follow the prompts to enter connect and Enter (default value). Then, confirm KR4 is successfully connected to JLink as shown:
Type "connect" to establish a target connection, '?' for help
J-Link>connect
Device position in JTAG chain (IRPre,DRPre) <Default>: -1,-1 => Auto-detect
JTAGConf>
Device "RV32" selected.

Connecting to target via cJTAG
ConfigTargetSettings() start
ConfigTargetSettings() end - Took 11us
TotalIRLen = 5, IRPrint = 0x01
JTAG chain detection found 1 devices:
#0 Id: 0x161818F3, IRLen: 05, Unknown device
Assuming RISC-V TAP with DTM setup
Debug architecture:
  RISC-V debug: 0.13
  AddrBits: 8
  DataBits: 32
  IdleClks: 7
Memory access:
  Via system bus: No
  Via ProgBuf: Yes (2 ProgBuf entries)
  Via abstract command (AAM): May be tried as last resort
DataBuf: 2 entries
  autoexec[0] implemented: Yes
Detected: RV32 core
Temp. halting CPU for for feature detection...
HW instruction/data BPs: 8
Support set/clr BPs while running: No
HW data BPs trigger after execution of inst
CSR access via abs. commands: Yes
Compressed instruction support: Yes
Feature detection done. Restarting core...
BG memory access Description: Default access mode
RISC-V identified.support: No
Memory zones:
Zone: "Default"
Run
/amebasmart_gcc_project/utils/jlink_script/ca32_jlink_core0.shFollow the prompts to enter connect and Enter (default value). Then, confirm CA32 core0 is successfully connected to JLink, as shown:
Type "connect" to establish a target connection, '?' for help
J-Link>connect
Specify target interface speed [kHz]. <Default>: 4000 kHz
Speed>
Device "CORTEX-A32" selected.

Connecting to target via SWD
InitTarget() start
******************************************************
J-Link script: AmebaSmart (Cortex-A32 CPU0) J-Link script
******************************************************
******************************************************
J-Link script: ResetTarget()
******************************************************
EDPRSR: 0x00000801
InitTarget() end - Took 16.3ms
Found SW-DP with ID 0x6BA02477
DPIDR: 0x6BA02477
CoreSight SoC-400 or earlier
AP map detection skipped. Manually configured AP map found.
AP[0]: AHB-AP (IDR: Not set, ADDR: 0x00000000)
AP[1]: AHB-AP (IDR: Not set, ADDR: 0x00000000)
AP[2]: AHB-AP (IDR: Not set, ADDR: 0x00000000)
AP[3]: APB-AP (IDR: Not set, ADDR: 0x00000000)
Using preconfigured AP[3] as APB-AP
AP[3]: APB-AP found
DebugRegs + CTI manually specified. ROM table scan skipped.
Cortex-A32 @ 0x80030000 (configured)
CoreCTI @ 0x80038000 (configured)
Debug architecture: ARMv8.0
6 code breakpoints, 4 data breakpoints
Processor features:
  EL0 support: AArch32
  EL1 support: AArch32
  EL2 support: AArch32
  EL3 support: AArch32
  FPU support: Single + Double + Conversion
Add. info (CPU temp. halted)
Current exception level: EL1
Exception level AArch usage:
  EL0: AArch32
  EL1: AArch32
  EL2: AArch32
  EL3: AArch32
Non-secure status: Non-secure
Cache info:
  Inner cache boundary: none
  LoU Uniprocessor: 1
  LoC: 2
  LoU Inner Shareable: 1
I-Cache L1: 32 KB, 256 Sets, 64 Bytes/Line, 2-Way
D-Cache L1: 32 KB, 128 Sets, 64 Bytes/Line, 4-Way
Unified-Cache L2: 256 KB, 512 Sets, 64 Bytes/Line, 8-Way
Memory zones:
  Zone: "Default" Description: Default access mode
  Zone: "AP0" Description: MEM-AP (AHB-AP)
  Zone: "AP1" Description: MEM-AP (AHB-AP)
  Zone: "AP2" Description: MEM-AP (AHB-AP)
  Zone: "AP3" Description: MEM-AP (APB-AP)
Cortex-A32 identified.
Run
/amebasmart_gcc_project/utils/jlink_script/ca32_jlink_core1.shFollow the prompts to enter connect and Enter (default value). Then, confirm CA32 core1 is successfully connected to JLink, as shown:
Type "connect" to establish a target connection, '?' for help
J-Link>connect
Specify target interface speed [kHz]. <Default>: 4000 kHz
Speed>
Device "CORTEX-A32" selected.

Connecting to target via SWD
InitTarget() start
******************************************************
J-Link script: AmebaSmart (Cortex-A32 CPU0) J-Link script
******************************************************
******************************************************
J-Link script: ResetTarget()
******************************************************
EDPRSR: 0x0000000B
InitTarget() end - Took 16.8ms
Found SW-DP with ID 0x6BA02477
DPIDR: 0x6BA02477
CoreSight SoC-400 or earlier
AP map detection skipped. Manually configured AP map found.
AP[0]: AHB-AP (IDR: Not set, ADDR: 0x00000000)
AP[1]: AHB-AP (IDR: Not set, ADDR: 0x00000000)
AP[2]: AHB-AP (IDR: Not set, ADDR: 0x00000000)
AP[3]: APB-AP (IDR: Not set, ADDR: 0x00000000)
Using preconfigured AP[3] as APB-AP
AP[3]: APB-AP found
DebugRegs + CTI manually specified. ROM table scan skipped.
Cortex-A32 @ 0x80032000 (configured)
CoreCTI @ 0x80039000 (configured)
Debug architecture: ARMv8.0
6 code breakpoints, 4 data breakpoints
Processor features:
  EL0 support: AArch32
  EL1 support: AArch32
  EL2 support: AArch32
  EL3 support: AArch32
  FPU support: Single + Double + Conversion
Add. info (CPU temp. halted)
Current exception level: EL1
Exception level AArch usage:
  EL0: AArch32
  EL1: AArch32
  EL2: AArch32
  EL3: AArch32
Non-secure status: Non-secure
Cache info:
  Inner cache boundary: none
  LoU Uniprocessor: 1
  LoC: 2
  LoU Inner Shareable: 1
I-Cache L1: 32 KB, 256 Sets, 64 Bytes/Line, 2-Way
D-Cache L1: 32 KB, 128 Sets, 64 Bytes/Line, 4-Way
Unified-Cache L2: 256 KB, 512 Sets, 64 Bytes/Line, 8-Way
Memory zones:
  Zone: "Default" Description: Default access mode
  Zone: "AP0" Description: MEM-AP (AHB-AP)
  Zone: "AP1" Description: MEM-AP (AHB-AP)
  Zone: "AP2" Description: MEM-AP (AHB-AP)
  Zone: "AP3" Description: MEM-AP (APB-AP)
Cortex-A32 identified.
Run
/amebasmart_gcc_project/utils/jlink_script/km4_jlink.shFollow the prompts to enter connect and Enter (default value). Then, confirm KM4 is successfully connected to JLink, as shown:
Type "connect" to establish a target connection, '?' for help
J-Link>connect
Specify target interface speed [kHz]. <Default>: 4000 kHz
Speed>
Device "CORTEX-M33" selected.

Connecting to target via SWD
InitTarget() start
InitTarget() end - Took 225us
Found SW-DP with ID 0x6BA02477
DPIDR: 0x6BA02477
CoreSight SoC-400 or earlier
AP map detection skipped. Manually configured AP map found.
AP[0]: AHB-AP (IDR: Not set, ADDR: 0x00000000)
AP[1]: AHB-AP (IDR: Not set, ADDR: 0x00000000)
AP[2]: AHB-AP (IDR: Not set, ADDR: 0x00000000)
AP[3]: APB-AP (IDR: Not set, ADDR: 0x00000000)
AP[1]: Core found
AP[1]: AHB-AP ROM base: 0xE00FF000
CPUID register: 0x721FD228. Implementer code: 0x72 (Realtek)
Feature set: Mainline
Cache: No cache
Found Cortex-M33 r1p8, Little endian.
FPUnit: 8 code (BP) slots and 0 literal slots
Security extension: implemented
Secure debug: enabled
CoreSight components:
ROMTbl[0] @ E00FF000
[0][0]: E000E000 CID B105900D PID 000F9133 DEVARCH 47702A04 DEVTYPE 00 SCS
[0][1]: E0001000 CID B105900D PID 000F9035 DEVARCH 47701A02 DEVTYPE 00 DWT
[0][2]: E0002000 CID B105900D PID 000F9034 DEVARCH 47701A03 DEVTYPE 00 FPB
Memory zones:
  Zone: "Default" Description: Default access mode
Cortex-M33 identified.
Run
/amebasmart_gcc_project/utils/jlink_script/km0_jlink.shFollow the prompts to enter connect and Enter (default value). Then, confirm KM0 is successfully connected to JLink, as shown:
Type "connect" to establish a target connection, '?' for help
J-Link>connect
Specify target interface speed [kHz]. <Default>: 4000 kHz
Speed>
Device "CORTEX-M23" selected.

Connecting to target via SWD
InitTarget() start
******************************************************
J-Link script: AmebaSmart KM0 J-Link script
******************************************************
InitTarget() end - Took 306us
Found SW-DP with ID 0x6BA02477
DPIDR: 0x6BA02477
CoreSight SoC-400 or earlier
AP map detection skipped. Manually configured AP map found.
AP[0]: AHB-AP (IDR: Not set, ADDR: 0x00000000)
AP[1]: AHB-AP (IDR: Not set, ADDR: 0x00000000)
AP[2]: AHB-AP (IDR: Not set, ADDR: 0x00000000)
AP[3]: APB-AP (IDR: Not set, ADDR: 0x00000000)
AP[0]: Core found
AP[0]: AHB-AP ROM base: 0xE00FF000
CPUID register: 0x721CD208. Implementer code: 0x72 (Realtek)
Feature set: Baseline
Cache: L1 I/D-cache present
Found Cortex-M23 r1p8, Little endian.
FPUnit: 8 code (BP) slots and 0 literal slots
Security extension: not implemented
CoreSight components:
ROMTbl[0] @ E00FF000
[0][0]: E000E000 CID B105900D PID 000F9013 DEVARCH 47702A04 DEVTYPE 00 SCS
[0][1]: E0001000 CID B105900D PID 000F9015 DEVARCH 47701A02 DEVTYPE 00 DWT
[0][2]: E0002000 CID B105900D PID 000F9014 DEVARCH 47701A03 DEVTYPE 00 FPB
I-Cache L1: 16 KB, 256 Sets, 32 Bytes/Line, 2-Way
D-Cache L1: 8 KB, 128 Sets, 32 Bytes/Line, 2-Way
Memory zones:
  Zone: "Default" Description: Default access mode
Cortex-M23 identified.
Connect JLink
Run
/amebagreen2_gcc_project/utils/jlink_script/ap_jlink.shFollow the prompts to enter connect and Enter (default value) to confirm that KM4TZ is successfully connected to JLink, as shown:
Type "connect" to establish a target connection, '?' for help
J-Link>connect
Specify target interface speed [kHz]. <Default>: 4000 kHz
Speed>
Device "CORTEX-M33" selected.

Connecting to target via SWD
InitTarget() start
******************************************
J-Link script: AP1 J-Link script
******************************************
InitTarget() end - Took 221us
Found SW-DP with ID 0x6BA02477
DPIDR: 0x6BA02477
CoreSight SoC-400 or earlier
AP map detection skipped. Manually configured AP map found.
AP[0]: APB-AP (IDR: Not set, ADDR: 0x00000000)
AP[1]: AHB-AP (IDR: Not set, ADDR: 0x00000000)
AP[1]: Core found
AP[1]: AHB-AP ROM base: 0xE00FF000
CPUID register: 0x721FD22A. Implementer code: 0x72 (Realtek)
Feature set: Mainline
Cache: L1 I/D-cache present
Found Cortex-M33 r1p0, Little endian.
FPUnit: 4 code (BP) slots and 0 literal slots
Security extension: not implemented
CoreSight components:
ROMTbl[0] @ E00FF000
[0][0]: E000E000 CID B105900D PID 000F9023 DEVARCH 47702A04 DEVTYPE 00 SCS
[0][1]: E0001000 CID B105900D PID 000F9025 DEVARCH 47701A02 DEVTYPE 00 DWT
[0][2]: E0002000 CID B105900D PID 000F9024 DEVARCH 47701A03 DEVTYPE 00 FPB
I-Cache L1: 16 KB, 128 Sets, 32 Bytes/Line, 4-Way
D-Cache L1: 16 KB, 128 Sets, 32 Bytes/Line, 4-Way
Memory zones:
Zone: "Default" Description: Default access mode
Cortex-M33 identified.
Caution
Keep this window open for subsequent operations
Connect JLink
Run
/amebagreen2_gcc_project/utils/jlink_script/np_jlink.shFollow the prompts to enter connect and Enter (default value) to confirm that KM4NS is successfully connected to JLink, as shown:
Type "connect" to establish a target connection, '?' for help
J-Link>connect
Specify target interface speed [kHz]. <Default>: 4000 kHz
Speed>
Device "CORTEX-M33" selected.

Connecting to target via SWD
InitTarget() start
******************************************
J-Link script: AP1 J-Link script
******************************************
InitTarget() end - Took 278us
Found SW-DP with ID 0x6BA02477
DPIDR: 0x6BA02477
CoreSight SoC-400 or earlier
AP map detection skipped. Manually configured AP map found.
AP[0]: APB-AP (IDR: Not set, ADDR: 0x00000000)
AP[1]: AHB-AP (IDR: Not set, ADDR: 0x00000000)
AP[2]: AHB-AP (IDR: Not set, ADDR: 0x00000000)
AP[1]: Core found
AP[1]: AHB-AP ROM base: 0xE00FF000
CPUID register: 0x721FD22A. Implementer code: 0x72 (Realtek)
Feature set: Mainline
Cache: L1 I/D-cache present
Found Cortex-M33 r1p0, Little endian.
FPUnit: 4 code (BP) slots and 0 literal slots
Security extension: not implemented
CoreSight components:
ROMTbl[0] @ E00FF000
[0][0]: E000E000 CID B105900D PID 000F9023 DEVARCH 47702A04 DEVTYPE 00 SCS
[0][1]: E0001000 CID B105900D PID 000F9025 DEVARCH 47701A02 DEVTYPE 00 DWT
[0][2]: E0002000 CID B105900D PID 000F9024 DEVARCH 47701A03 DEVTYPE 00 FPB
I-Cache L1: 16 KB, 128 Sets, 32 Bytes/Line, 4-Way
D-Cache L1: 16 KB, 128 Sets, 32 Bytes/Line, 4-Way
Memory zones:
Zone: "Default" Description: Default access mode
Cortex-M33 identified.
JLink Core Command Set
Command (Full) |
Shortcut |
Syntax |
Description |
|---|---|---|---|
Halt |
H |
Suspend CPU execution |
|
Go |
G |
Resume CPU execution |
|
Mem |
/ |
Mem <Address> <ByteCount> |
Read memory (ASCII format) |
SaveBin |
/ |
SaveBin <File> <Address> <ByteCount> |
Dump memory to binary file |
Exit |
/ |
Disconnect JLink |
Official documentation: https://wiki.segger.com/J-Link_Commander
Note
Track PC values via multiple
H/GexecutionsUse
mem <sp_address>to inspect call stack
Ozone Debug
Ozone Software Installation
Download and install the latest version of JLink and Ozone from the official SEGGER website.
Install JLink and Ozone by following the steps below:
Download the latest versions of the JLink and Ozone software packages.
Execute the installation commands:
$ dpkg -i JLink_Linux_V840_x86_64.deb
$ dpkg -i Ozone_Linux_V338g_x86_64.deb
Ozone Project Configuration
Create, save, and run projects.
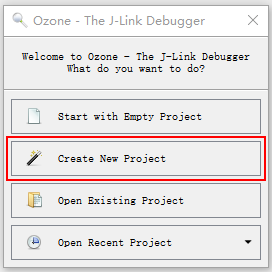
Connect JLink and launch Ozone to create a new project by following steps:
Enter the main interface and create a new project, as shown below:
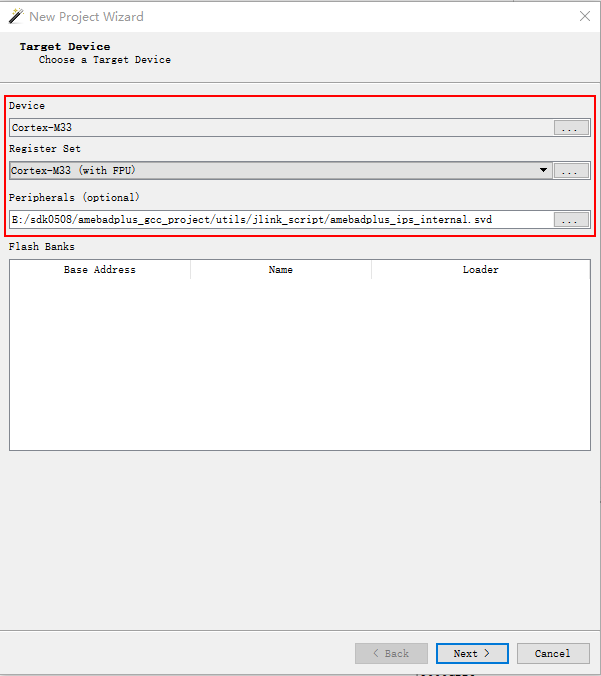
Select the target device and svd file, as shown below:
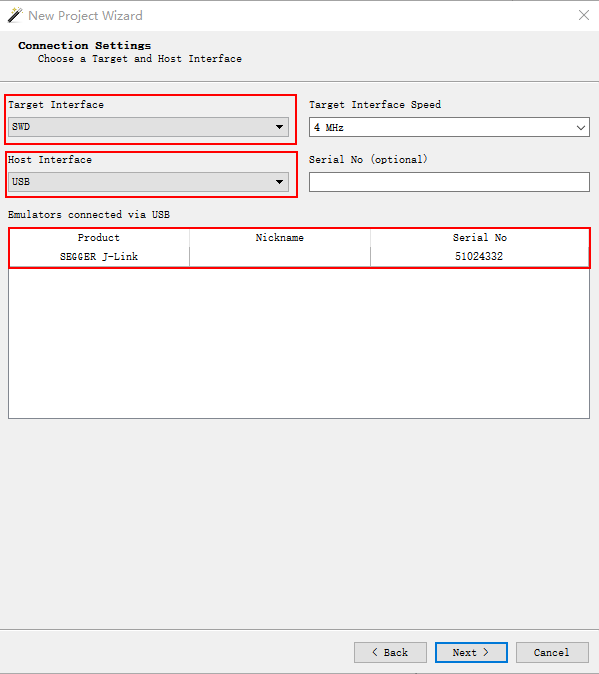
Configure connection settings: choose the interface and confirm the JLink device, as shown below:
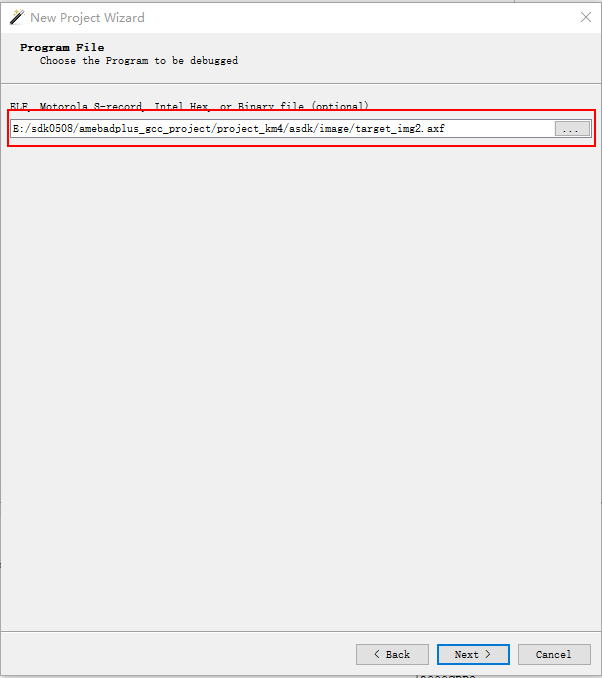
Select the debug file, as shown below:
Set initialization options
Initialization settings: Set Initial PC and Stack Pointer to
Do not set.Select the corresponding JLinkScript file from the
amebaxxxx_gcc_project/utils/jlink_scriptdirectory, as shown below: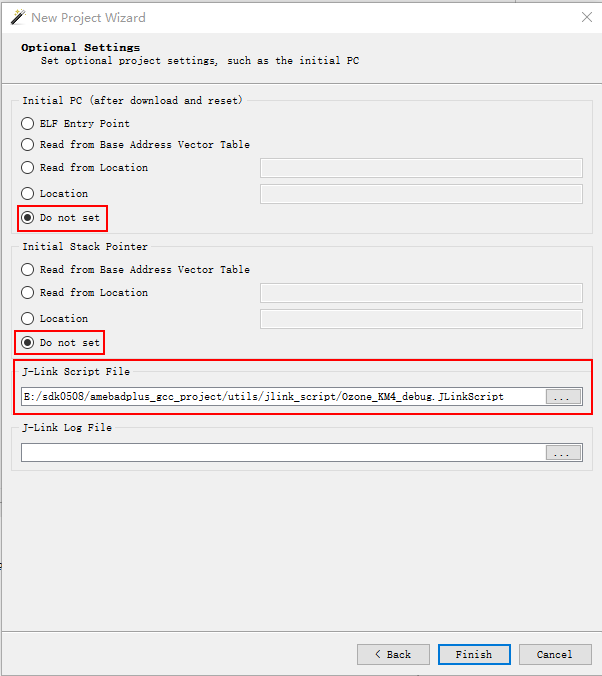
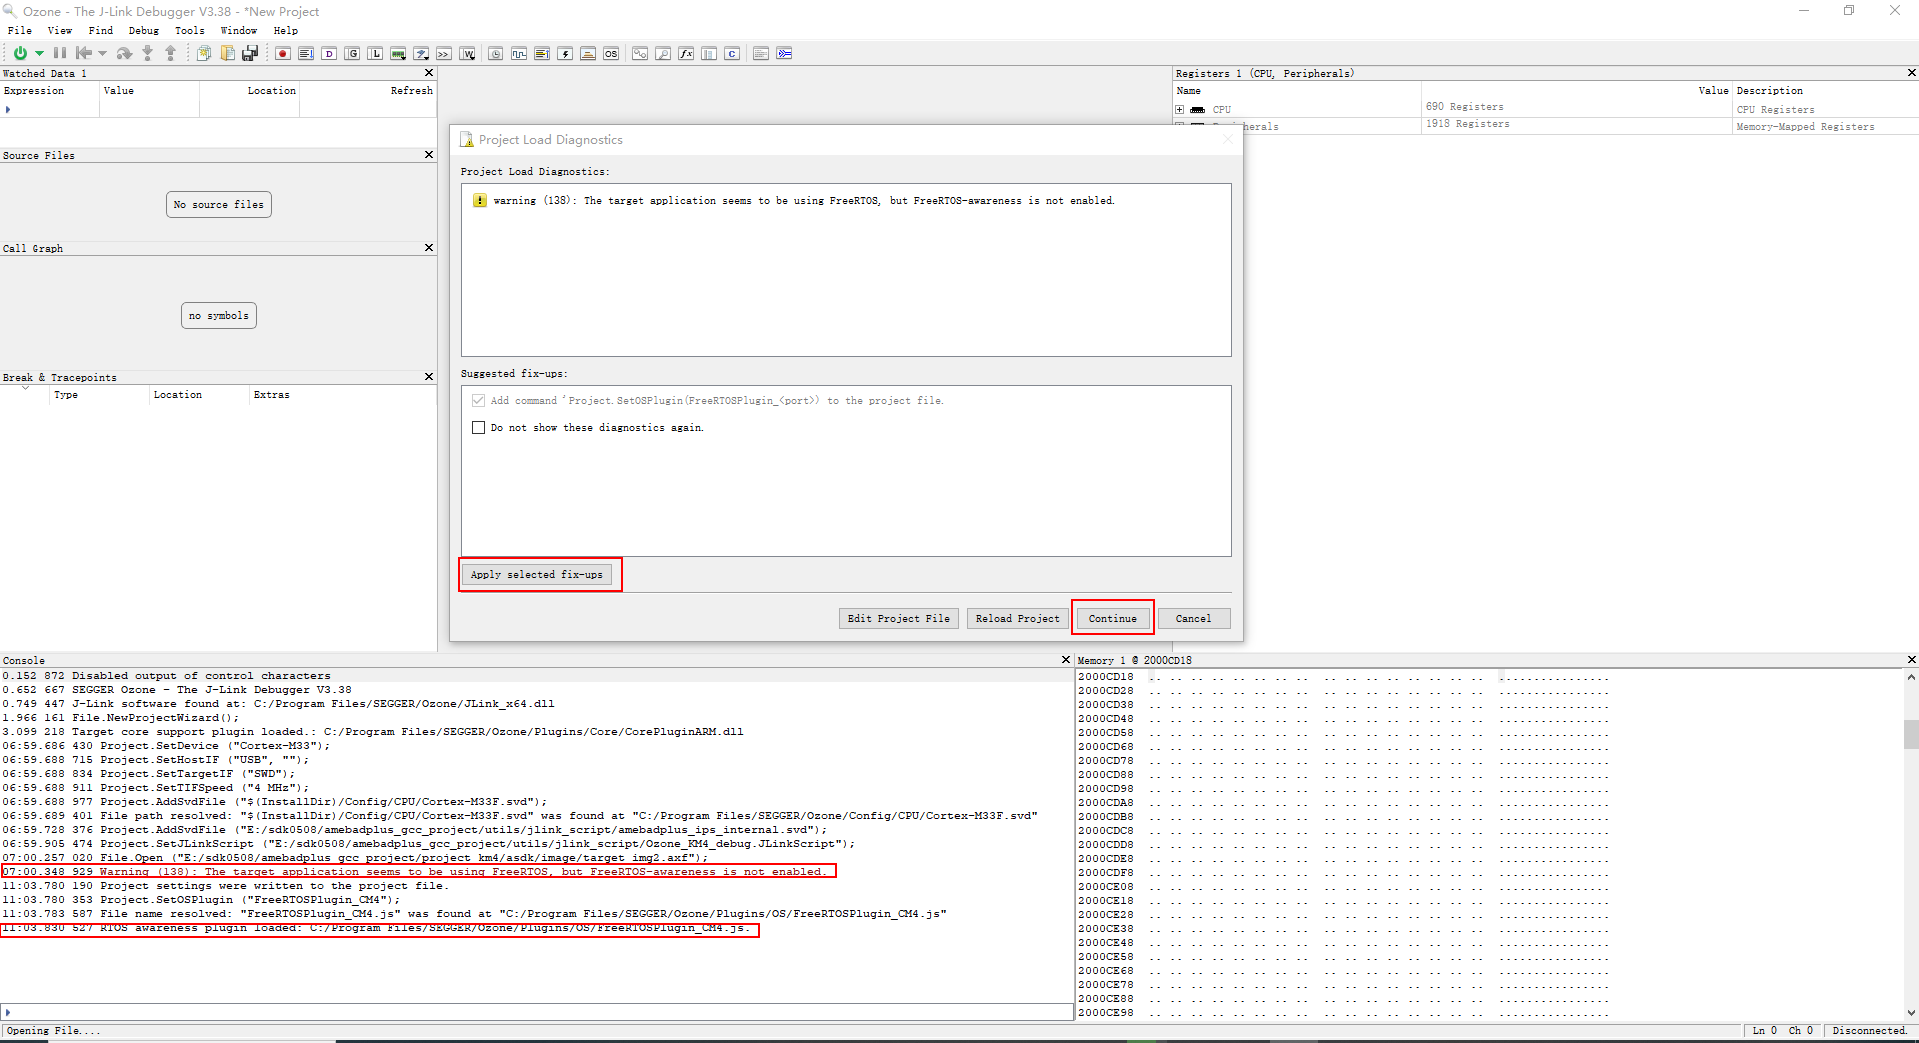
Handle Plugin installation warning
Install: Click to install automatically. The installation result will be shown in the
Consolewindow.Do not install: Click to proceed without installing.
Project created successfully
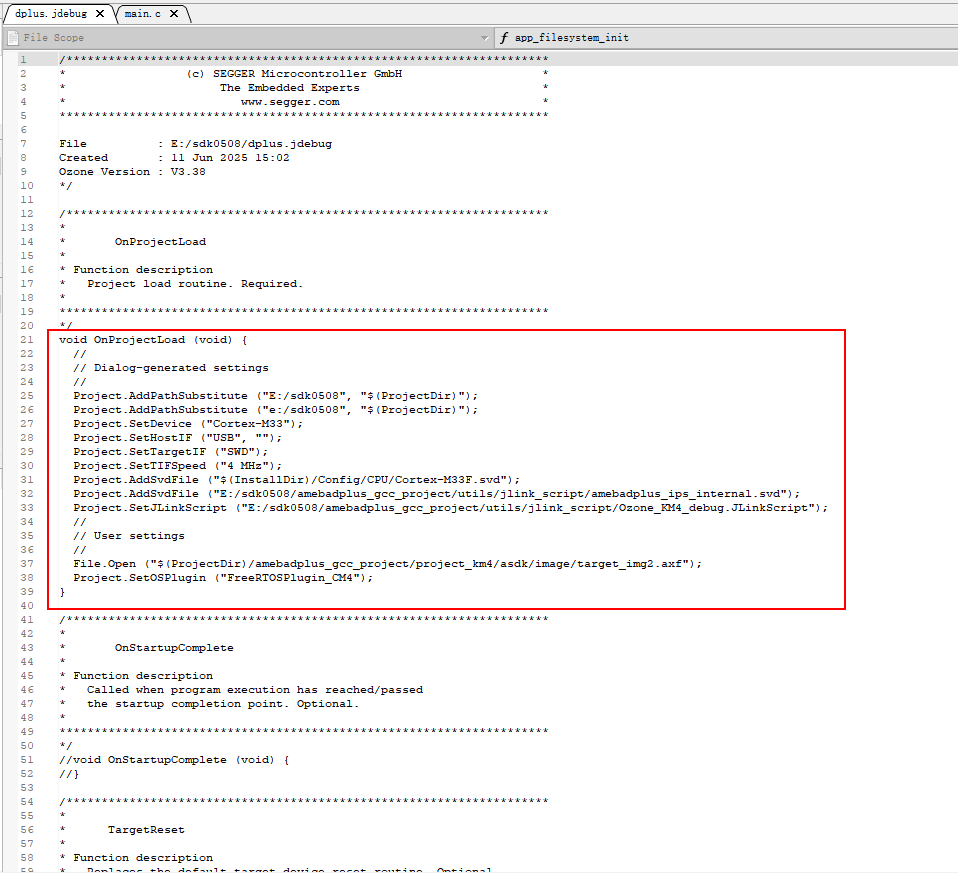
Save Project Configuration: Click , you can import and use it next time directly.
Edit Project Configuration: Click , the settings displayed below in the red frame can be modified.
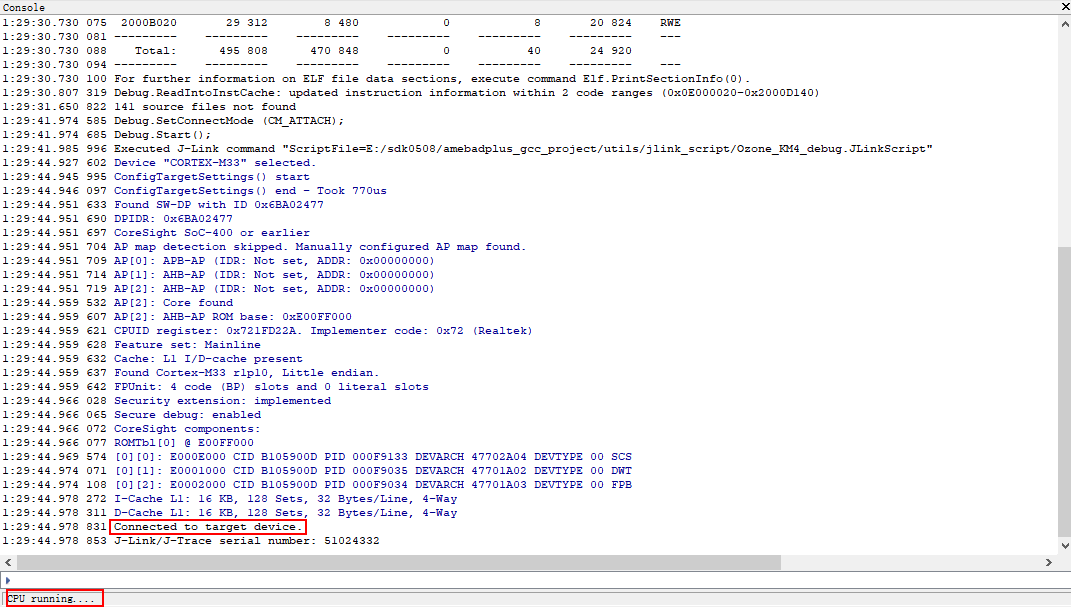
After confirming that the development board has been flashed with firmware and is correctly connected to JLink, Reset the development board to enter working mode. Ozone provides three modes for running projects:
Download & Reset Program: This mode is not supported.
Attach to Running Program: After starting the project, CPU will be in the running state. As shown below, click Stop to pause the CPU..
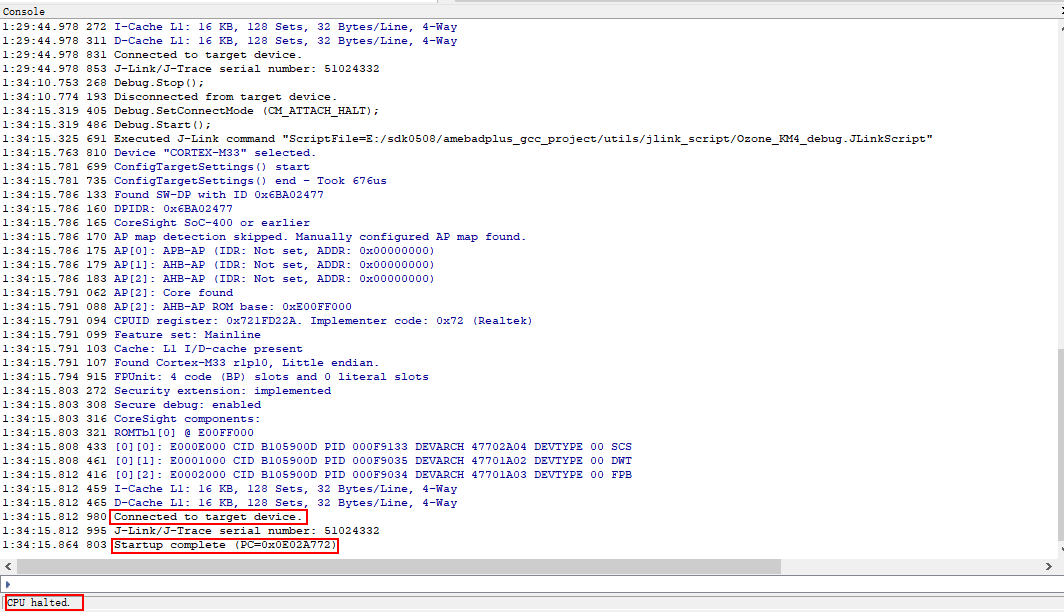
Attach & Halt Program: After running the project, the CPU will be in the halted state. As shown below, click start to run the CPU.
Caution
Do not reset the development board after running the project in Ozone; otherwise, JLink will disconnect.
Ozone Debug Features
In this section, commonly used debug features are introduced. Click to see the debug functions supported by Ozone.
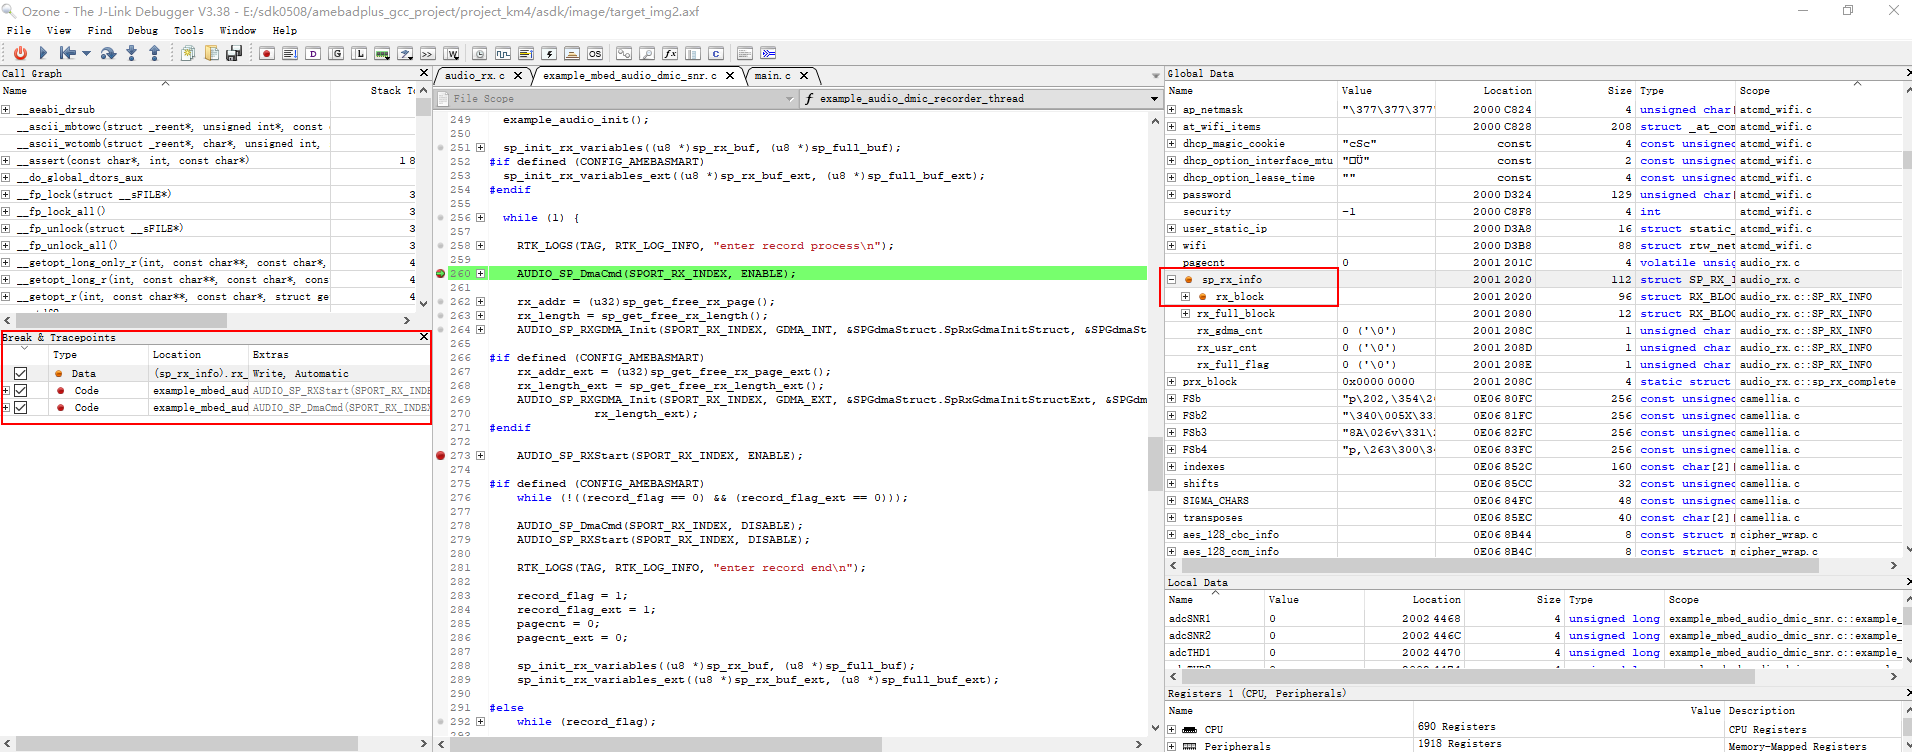
Adding Breakpoints
Code breakpoint: In the C file opened in the File Scope area, click the gray dot to the left of the code line to add a breakpoint.
Data breakpoint: In the
Break & TracePointswindow, right-click on a blank area and use the drop-down menu to add a breakpoint by variable name or address. Alternatively, right-click a variable name in the global or local variable window and select the option to add it as a breakpoint.
Removing Breakpoints
Code breakpoint: Click the red dot to the left of the code line. When it changes to a gray dot, the breakpoint is removed.
In the Break & TracePoints window: Right-click on a blank area and use the drop-down menu to remove a breakpoint.
Enable/disable: In the
Break & TracePointswindow, click √ to the left of the breakpoint to enable or disable it.
Viewing Breakpoints
When the program reaches a breakpoint, it will pause and the corresponding line of code will be highlighted in green, as shown below:
Caution
The number of breakpoints that can be set is limited. If exceed this limit, the following error message will appear
SetBreakpoint: JLINK API call failed.
Restart the development board from a known initial state. This facilitates troubleshooting problems related to power-on initialization and peripheral configuration. There are three reset modes:
Reset & Break at Symbol: Resets and automatically pauses at the specified symbol (the entry to the main function usually ).
Reset & Halt: Resets and stops at the address of the reset vector.
Reset & Run: Performs initialization and continues execution until a breakpoint is hit or the program ends normally.
There are three types of single-step debugging operations:
Step Into: Executes the program one statement at a time. If the current statement is a function call, it enters the function and executes from its first statement.
Step Over: Executes the program one statement at a time. When encountering a function call, it executes the entire function but does not step into it, stopping at the next statement in the current function.
Step Out: Executes until the current function returns, then stops at the next statement in the calling function.
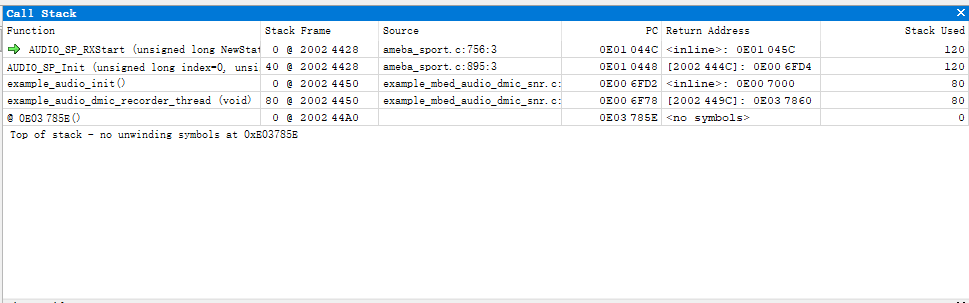
Displays the program’s current execution position and the nesting of function calls. Each stack frame corresponds to a function context. This view shows the order of all function calls from program entry to the current breakpoint and is a critical tool for analyzing program flow and tracing exceptions.
On chips with two independent CPU cores, you can set breakpoints, watch variables, single-step, and analyze call stacks for both cores simultaneously or alternately.
Debugging method: Create separate projects for the two CPU cores, and after connecting successfully, debug each core as needed.
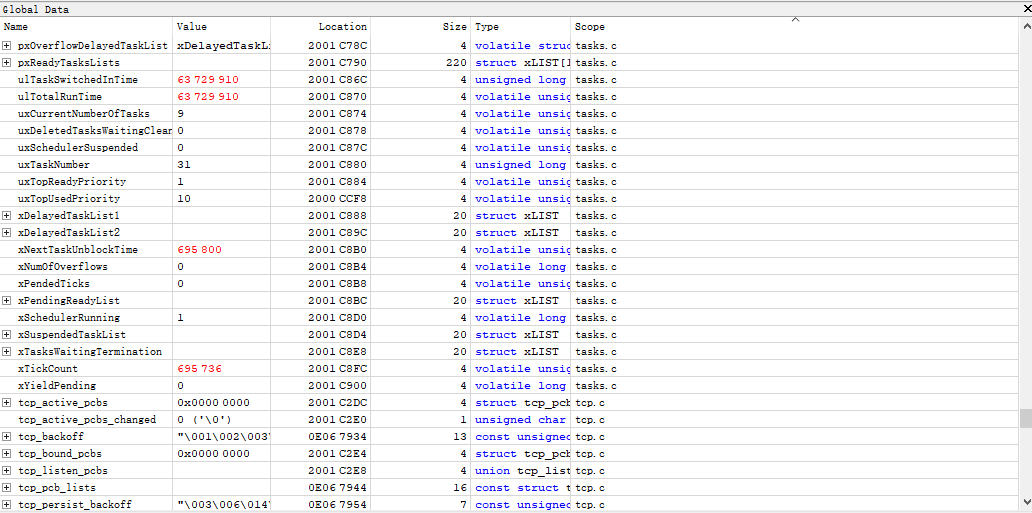
The Global Variables window is grayed out and not editable while the CPU is running. When the CPU is paused, the window displays the current values. If a value has changed during execution, it will be highlighted in red.
Double-click the value you want to edit. After modifying it, the new value will appear in red.
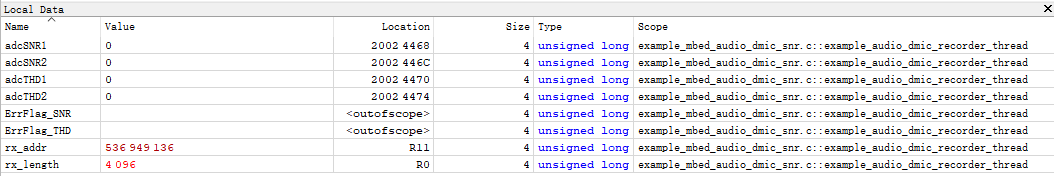
The Local Variables window shows parameters and variables exclusively for the current function context when the CPU is paused.
The Local Variables window is grayed out and not editable while the CPU is running. When the CPU is paused, the window displays the current values. If a value has changed during execution, it will be highlighted in red.
Double-click the value you want to edit. After modifying it, the new value will appear in red.
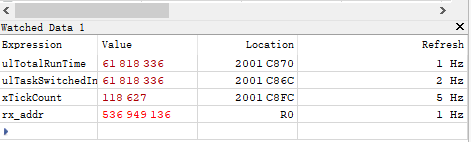
Right-click a variable in the global or local variables window and select Watch to add it to the Watched Data window. Double-click in the Refresh column to edit the refresh rate.
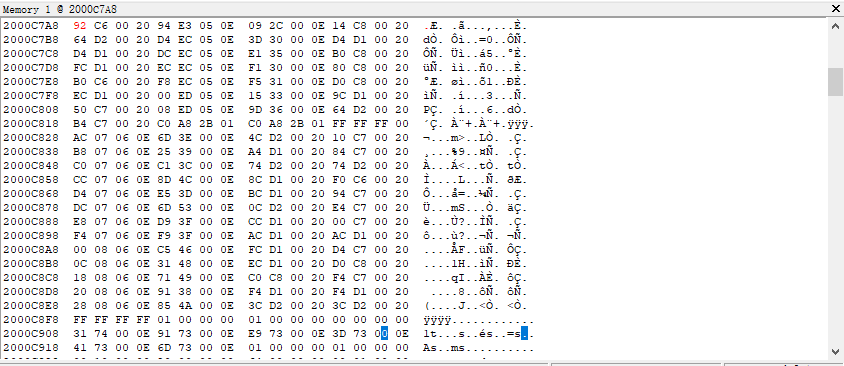
Open the Memory window to view data at memory addresses. To edit a value, double-click it. After you make a change, the modified value is highlighted in red.
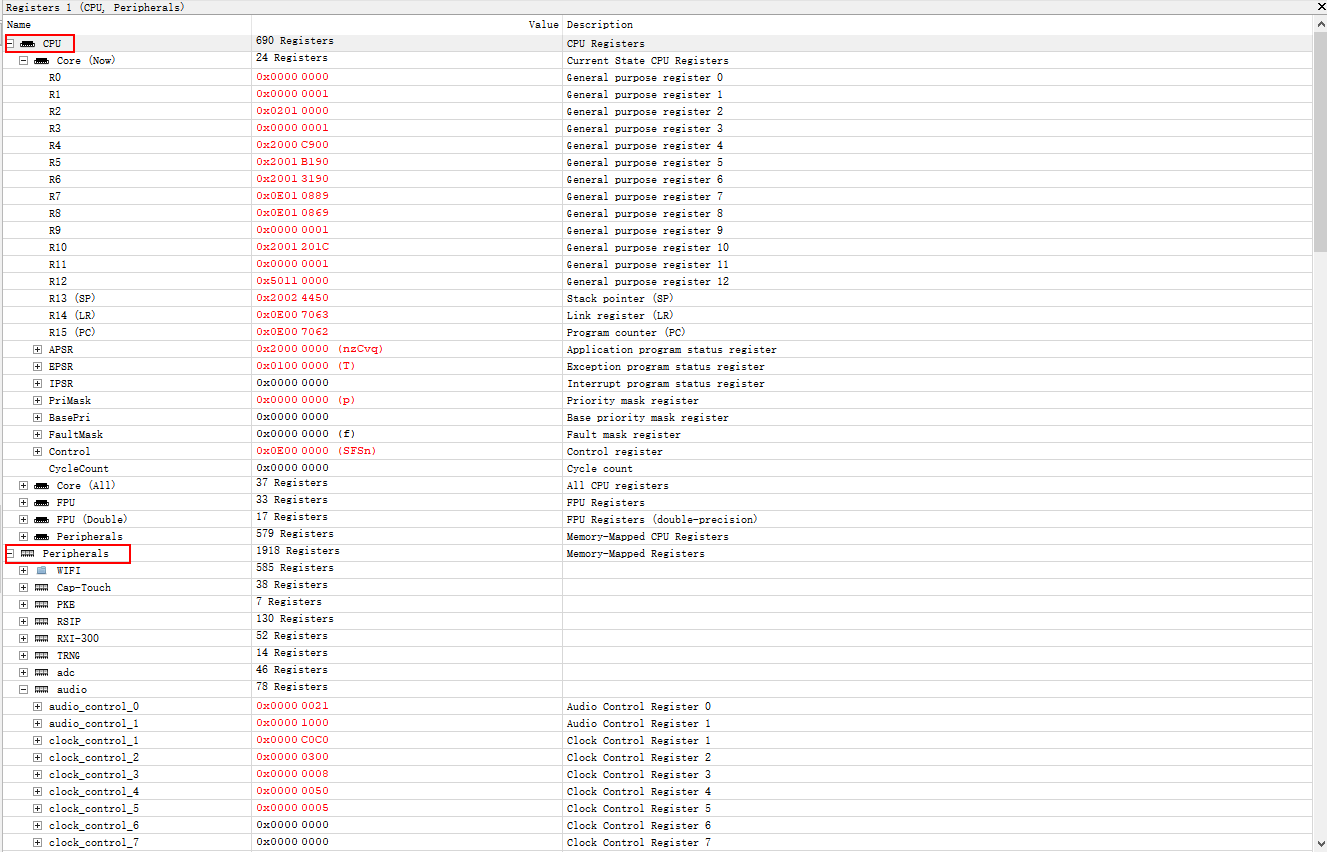
The Registers window is divided into CPU registers and peripheral registers.
The Register window is grayed out and not editable while the CPU is running. When the CPU is paused, the window displays the current values. If a value has changed during execution, it will be highlighted in red.
Double-click the value you want to edit. After modifying it, the new value will appear in red.
Ozone Command Set
The Ozone debugger supports checking program status and tracing errors during execution. To view all available commands, enter help in the Console window.
Official documentation reference: Ozone User Manual