LOG Tool
Resources
Introduction
Trace Tool is an official serial logging tool for Ameba SoC series developed by Realtek. Through the LOGUART port, it allows developers to send commands to and receive logs from devices in real-time.
Compared to generic serial port tools, Trace Tool offers the following advanced functionalities:
AGG support
Parses multi-core logs when LOGUART AGG function is enabled and appends corresponding core tags to each log entry.
Scope
Displays data from specifically formatted logs in waveform
Automation script
Parses automation scripts, automatically sends commands and captures specific patterns from logs.
WiFi debugging
Supports access of WiFi-related registers and WiFi debugging
BT logs
Facilitates acquisition of BT-related logs
Note
If the above advanced features are not required, generic serial port tools can be used as alternatives to Trace Tool.
The UI of Trace Tool is shown below:
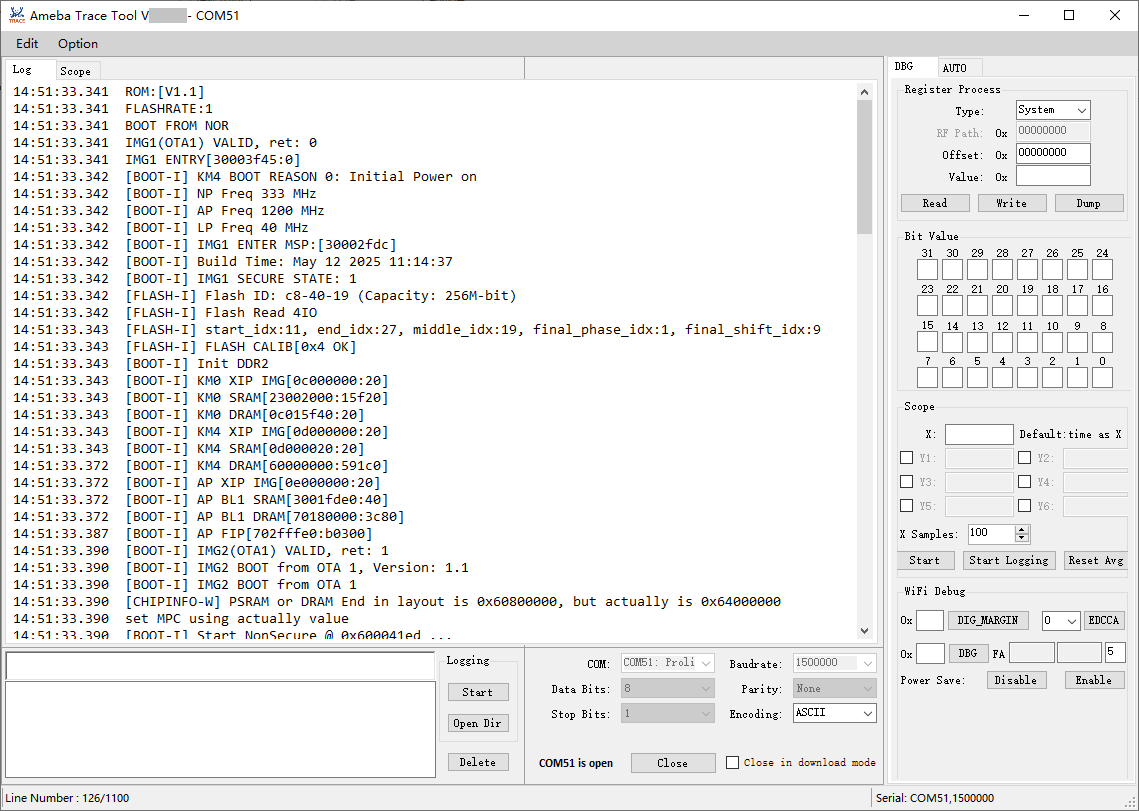
Menu items:
Edit: Used for clear history logs, clear historical commands, load and save operationsOption:Global Settings: including settings for the number of lines and timestampsTag Filter: used to append different tags to the logs when LOGUART AGG is enabled
Hardware Connection
The hardware connection is illustrated below:

Software Setup
Environment requirements:
WinXP above
.NET Framework 4.0
Software location:
{SDK}/tools/ameba/TraceTool/AmebaTraceTool.exe
Note
Install the driver for the USB-to-UART adapter (e.g., PL2303GC) on the host first; otherwise, the host will not be able to recognize the LOGUART port.
Download the appropriate driver from the official website of the corresponding USB-to-UART adapter supplier.
Log Print
Basic Usage
After setting the environment mentioned in Section Hardware Connection, execute the following steps:
Select serial port in COM box.
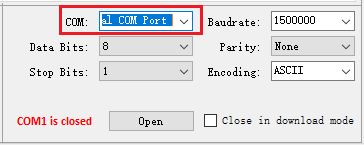
Configure the serial port.
Baudrate: The default value is 1500000bps.
Data Bits: The default value is 8.
Parity: The default value is “None”.
Stop Bits: The default value is 1.
Encoding: The default value is UTF8.
These parameters must be consistent with the LOGUART settings on the device side.
Additionally, a Close in download mode checkbox is provided, when enabled, Trace Tool automatically closes the serial port upon detecting the SoC entering download mode.
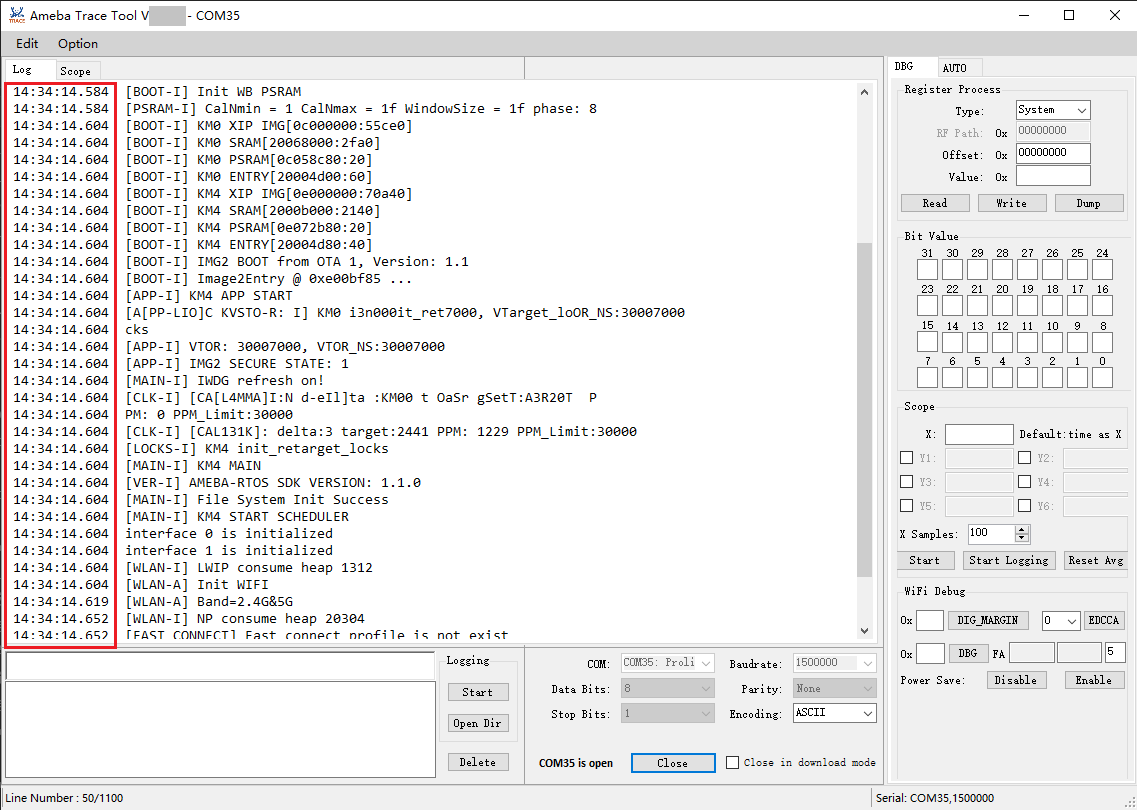
Click the Open button to open the serial port and start to receive the logs from device.
Log messages will be printed on Log Tab and the text of Open button will be switched to Close.
To stop receiving the logs, click the Close button to close the serial port.
Log Saving
To save the logs to local file:
Click Start button in Logging box, all the received logs will be saved to the specified
.txtfile.
Note
For segmented logs, click Option and Global Settings to set the log size.
Click the Open Dir button in Logging box to open the folder where the log file are saved.
AGG Support
Trace Tool automatically detects whether the LOGUART AGG feature is enabled and processes logs accordingly.
AGG enabled
When AGG is enabled, Trace Tool supports parsing AGG header information and prepends MCU tags to logs. To add corresponding MCU tags to logs:
Click the Option button
Select the appropriate tag combination under Tag Filter for the connected SoC
Supported MCU tags by SoC:
MCU Tags: KM0、KM4
MCU Tags: KM4、KR4
MCU Tags: KM4、KR4、DSP
MCU Tags: KM4、KR4、DSP
MCU Tags: KM0、KM4、CA32
MCU Tags: KM4NS、KM4TZ
Additionally, BT trace logs and BT firmware logs are also identified through AGG, Trace Tool automatically saves these logs to files. When LOGUART AGG is enabled, other serial tools may display garbled text due to inability to parse AGG headers.
AGG disabled
When AGG is disabled:
Logs do not include AGG header information
Trace Tool does not prepend MCU tags to log entries
In this case:
Log entries may become mixed when multiple MCUs print simultaneously
Users can use other serial tools to print logs if BT trace and firmware logs are not required
Note
By default, LOGUART AGG is disabled, to enable it, refer to User Configuration.
Temporary log display issues may occur when switching AGG between enabled and disabled states.
Timestamp
To add timestamps to log entries:
Click the Option menu
Select the Global Settings menu item
Check the Timestamp checkbox
Note
Displayed timestamps may lag behind actual log generation times due to processing delays in Trace Tool.
Send Commands
To send commands to attached device:
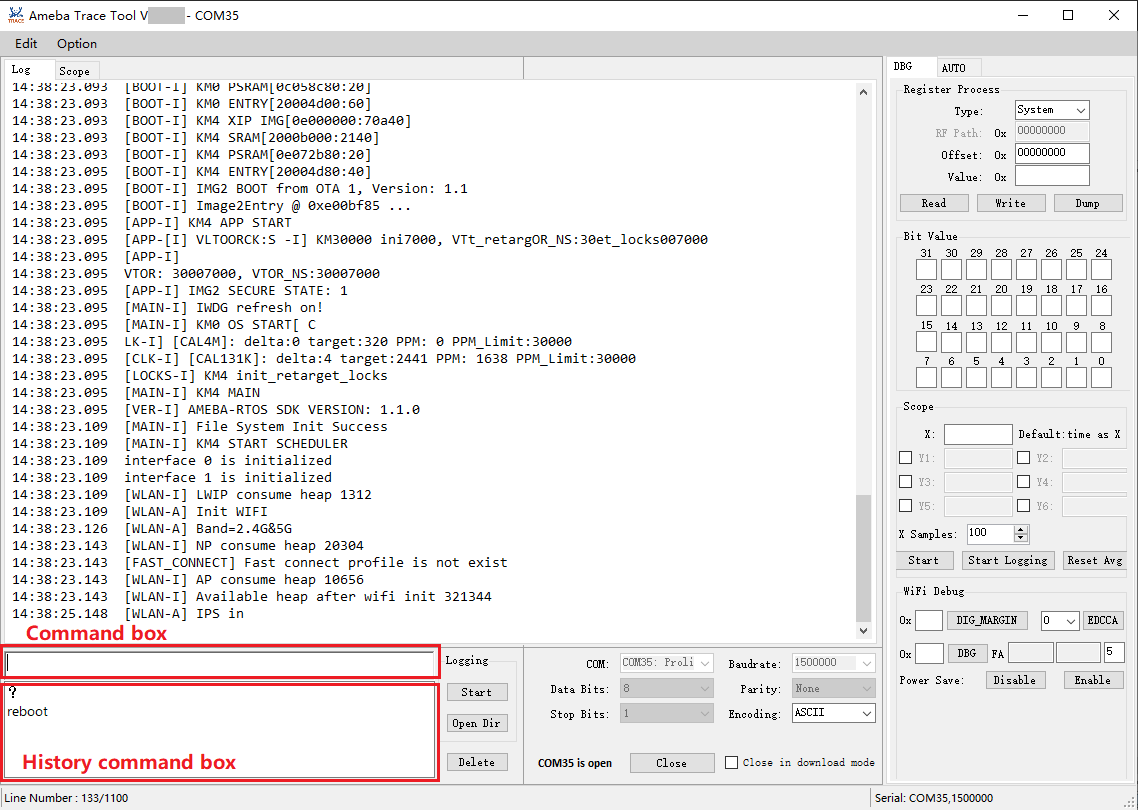
Input a command in the command box.
Note
Refer to Command Prefix to determine whether a command prefix needs to be added before the command.
Press the Enter key.
The history command box records previously sent commands.
Click a command to display it in the command input box.
Double-click a command to send it to the chip.
Click a command then click Delete to remove the command from the history command box.
Command Prefix
When multiple cores in different SoC models perform distinct roles, specific command prefixes shall be used to identify core-specific operations.
Core |
Role |
Command Prefix |
|---|---|---|
KM4 |
AP |
None |
KM0 |
NP |
@ |
Core |
Role |
Command Prefix |
|---|---|---|
KM4 |
NP |
@ |
KR4 |
AP |
None |
Core |
Role |
Command Prefix |
|---|---|---|
KM4 |
AP |
None |
KR4 |
NP |
@ |
Core |
Role |
Command Prefix |
|---|---|---|
DSP |
Algorithm |
~ |
KM4 |
NP |
@ |
KR4 |
AP |
None |
Core |
Role |
Command Prefix |
|---|---|---|
DSP |
Algorithm |
~ |
KM4 |
AP |
None |
KR4 |
NP |
@ |
Core |
Role |
Command Prefix |
|---|---|---|
DSP |
Algorithm |
~ |
KM4 |
NP |
@ |
KR4 |
AP |
None |
Core |
Role |
Command Prefix |
|---|---|---|
DSP |
Algorithm |
~ |
KM4 |
AP |
None |
KR4 |
NP |
@ |
Core |
Role |
Command Prefix |
|---|---|---|
CA32 |
AP |
None |
KM4 |
NP |
~ |
KM0 |
Firmware |
@ |
Core |
Role |
Command Prefix |
|---|---|---|
KM4TZ |
AP |
None |
KM4NS |
NP |
@ |
Register Access
The Register Access function is used to read from and write to register values via their addresses.
Type: Used to select the register type. The options Wifi MAC/Wifi BB/Wifi RF are for Wi-Fi functionalities, each having different base addresses. Please select the appropriate option based on your requirements.Read/Write Register: Enter the register address toReadorWritethe register value.Dumpsupports bulk printing only for Wifi MAC/Wifi BB/Wifi RF registers.Bit Value: Allow bit-wise access to the register specified by the address.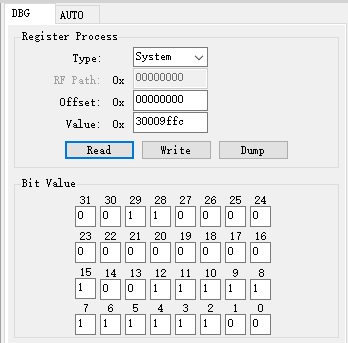
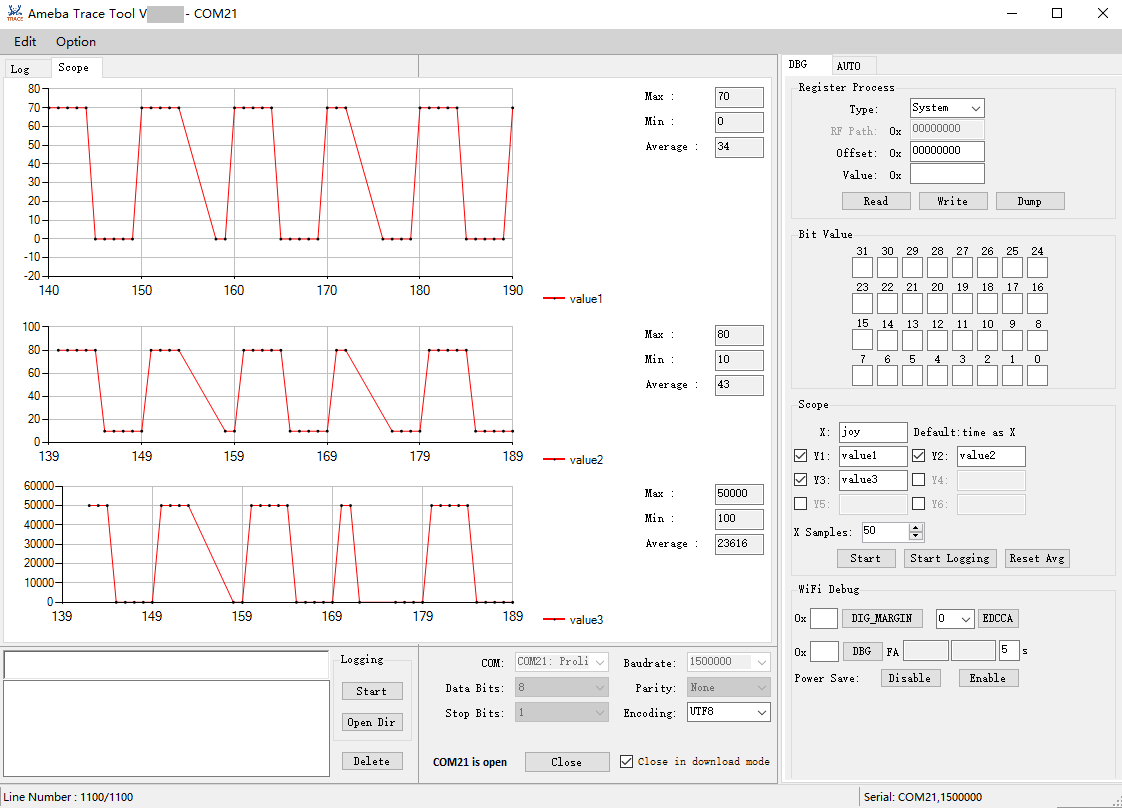
Scope Function
The scope function is used to capture specific data from logs and dynamically display waveform patterns. This feature has been supported since version v2.1.28.
Enter X and Y pattern, the default value of X is time.
Click Start button.
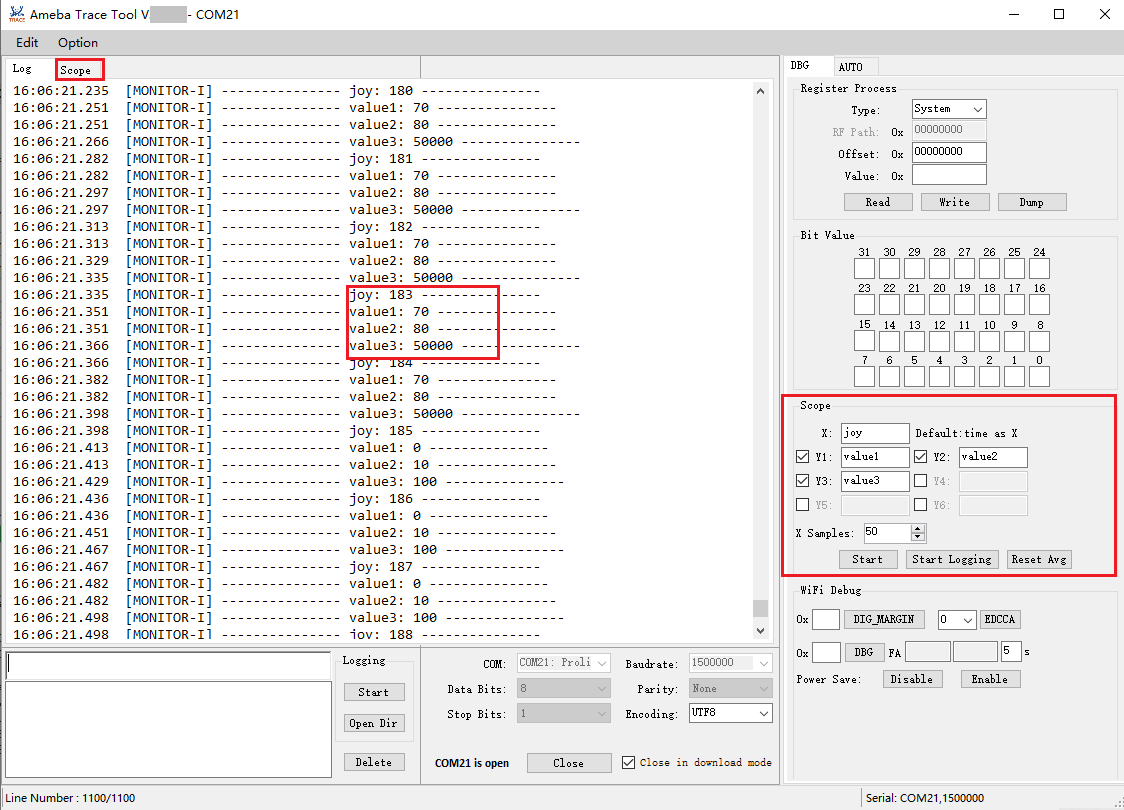
In the scope interface, waveform will be displayed synchronously.
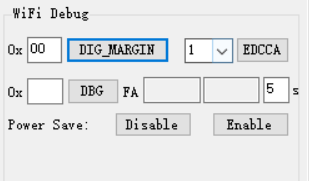
Wi-Fi Debug
DIG_MARGIN: Set Wi-Fi DIG margin, available address: [0x00,0x3c].EDCCA: Set MAC EDCCA mode, available value: 0/1/9.DBG: Set Wi-Fi RA debug, available address: [0,0xff], and display the average values of CCK_FA and OFDM_FA .Power Save: Enable or disable Wi-Fi power saving mode.
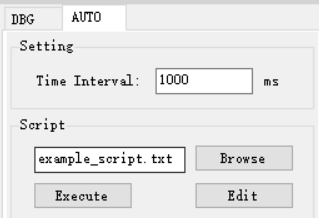
Automation Script
The AUTO tab provides support for automatic script execution.
Click
Browsebutton to choose the script you want to execute.Click
Executebutton to execute the script.
The general format of the automatic script:
CMD1
CMD2
CMD3
…
Keyword loop can be used to execute commands repeatedly:
loop=10
loop_start
CMD1
CMD2
sleep 1000
…
loop_end
The keywords and specific rules within the loop are as follows:
Loop: The number afterloop=means loop times.loop_start: Used to mark the beginning of the loop.loop_end: Used to mark the end of the loop.loop_startandloop_endmust appear in pairs.sleep: Used to delay some time between commands, and unit is millisecond.sleep 1000means to delay 1000ms. There should be a blank space between sleep and sleep time.
Nested loops are supported, and they can be structured as follows:
loop=2
loop_start
CMD1
sleep 1000
loop=3
loop_start
CMD2
sleep 2000
loop_end
loop_end
Catching certain patterns, like pass_pattern or fail_pattern , to indicate that the result of specific CMD execution is supported, the format is as below:
loop=10
loop_start
timeout=1000
pass_pattern=xxx
fail_patern=xxx
CMD1
if fail/pass/timeout
break
fi
CMD2
…
loop_end
The key word
pass_pattern,fail_patternandtimeoutare only valid for the next command CMD1, used to catch patterns in CMD1 execution.When a pattern is detected, the keyword
if...fican be used for subsequent operations. Currently, only thebreakoperation is supported, which is used to exit a loop.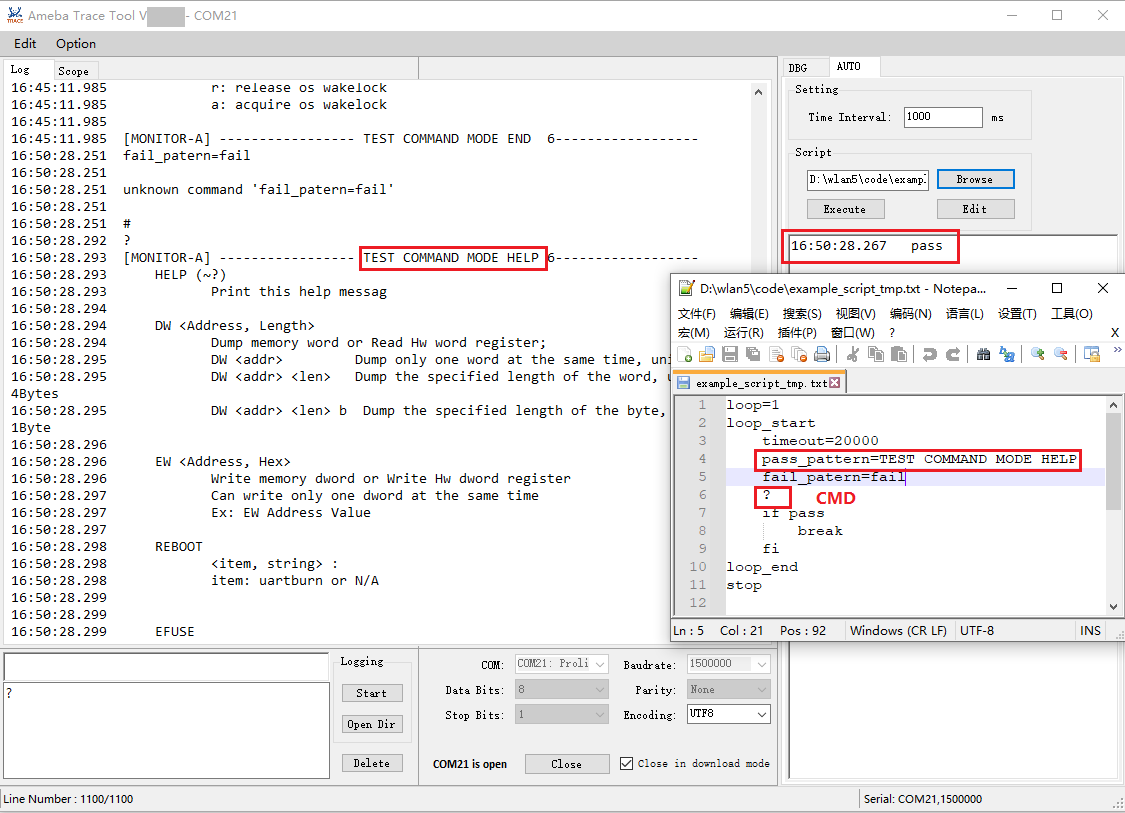
The number following
timeout=represents the waiting time for capturing matching characters. If this time is exceeded, capturing will stop. It can be set to different values as needed (unit: milliseconds), with a default value of 5000.The string following
pass_pattern=indicates the pass pattern, whilefail_pattern=indicates the fail pattern, used to denote the result of the CMD execution.
When executing a CMD, there are three possible outcomes:
Pass: pass_pattern is matched in the CMD execution result within the timeout period.Fail: fail_pattern is matched in the CMD execution result within the timeout period.Timeout: Neither pass_pattern nor fail_pattern is matched in the CMD execution result within the timeout period.
Caution
Only one command is allowed per line.
Indent a line using a TAB. Only TABs are permitted; spaces are not allowed.
No spaces are allowed before or after the “=”.