Debugging DSP Program
Make sure you have read section 1.2.3 before moving on. At this moment xt-ocd supports J-Link probe over Serial Wire Debug (SWD) for this DSP. You need to first install the J-Link driver. The version we use here is V6.44. Any newer version should be ok, but we haven’t tested on them.
Connecting DSP to J-Link
Suppose Xtensa OCD Daemon is installed under the path: C:\Program Files (x86)\Tensilica\Xtensa OCD Daemon 14.08.
Replace your topology.xml under the path C:\Program Files (x86)\Tensilica\Xtensa OCD Daemon 14.08 (for Linux, the file path is /opt/Tensilica/xocd-14.08/topology.xml) with the flowing code, then Change the usbser value according to your own J-Link S/N.
<configuration>
<controller id='Controller0' module='jlink' usbser='XXXXXX' type='swd' speed='4000000' locking='1'/>
<driver id='XtensaDriver0' dap='1' xdm-offset='0x80000000' module='xtensa' step-intr='mask,stepover,setps' />
<chain controller='Controller0'>
<tap id='TAP0' irwidth='5' />
</chain>
<system module='jtag'>
<component id='Component0' tap='TAP0' config='trax' />
</system>
<device id='Xtensa0' component='Component0' driver='XtensaDriver0' ap-sel='3'/>
<application id='GDBStub' module='gdbstub' port='20000'>
<target device='Xtensa0' />
</application>
</configuration>
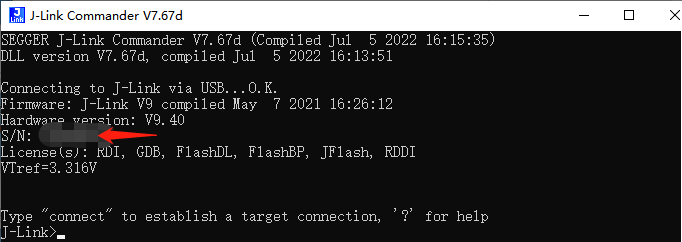
Make sure that the bypass-fastmem are consistent with the above example. You can find usbser in your J-Link commander:
Using Xplorer GUI to Debug the Program
When using Xplorer to debug DSP core, we recommend to erase full flash first then ONLY download KM4/KR4 image. DSP image will directly load into PSRAM by J-link when starting debug.
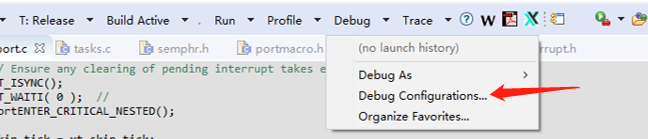
Press Debug Configurations…
Select Xtensa On Chip Debug, then create a new debug configuration.
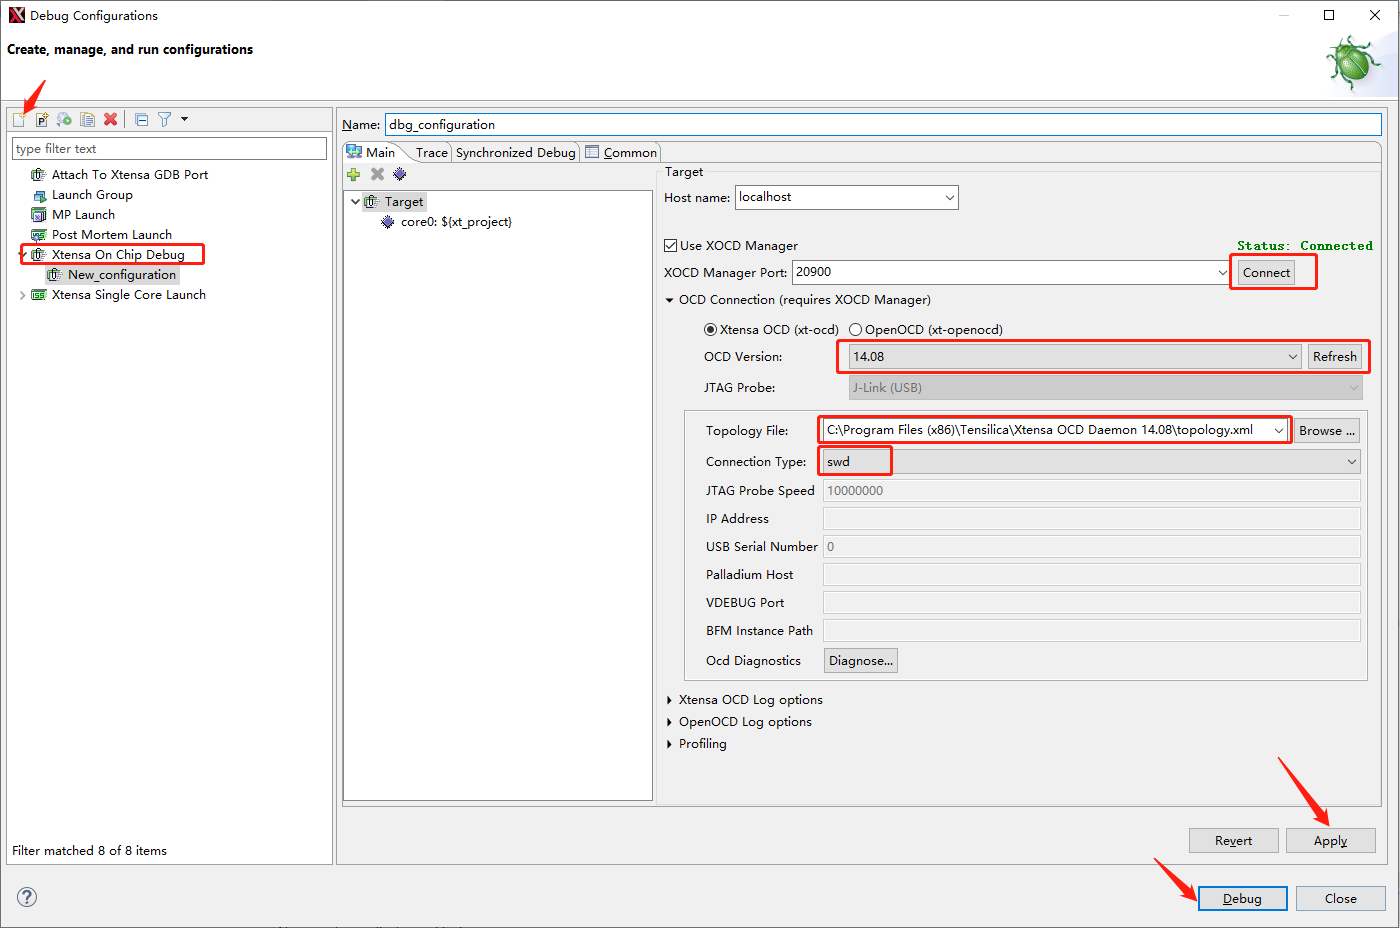
Check Use XOCD Manager option, then click on Connect button. Refresh OCD Version, then select 14.08 version. Topology File should choose
C:Program Files (x86)TensilicaXtensa OCD Daemon 14.08topology.xmlwhich we edited in the last section. Connection Type is SWD.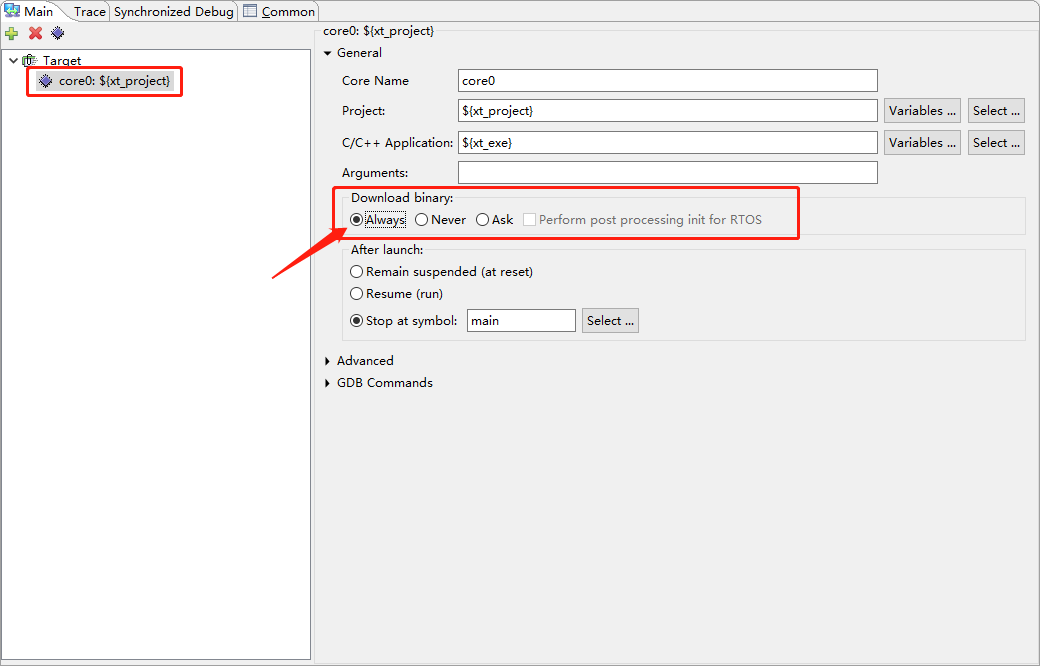
Select core0, then set Download binary to Always. Then Press Apply and Debug. By default, DSP core will stop at the first line of main function.
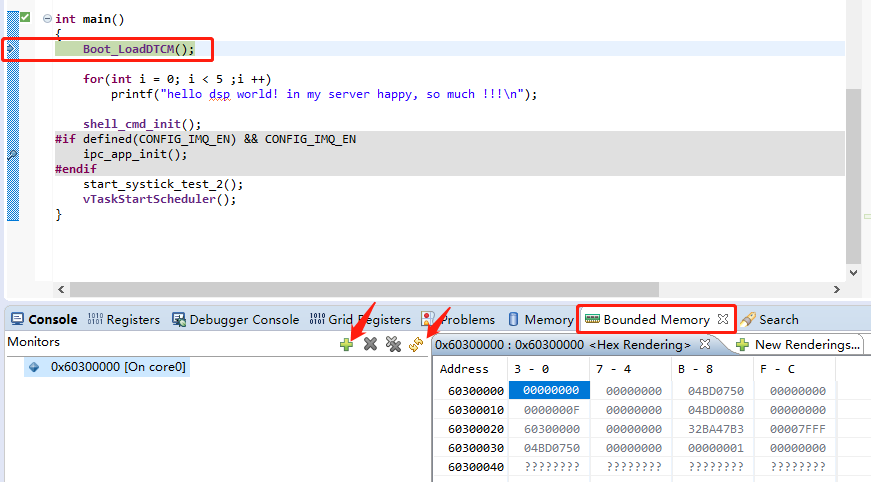
If you need to check memory value, we recommend to use the Bounded Memory and manually refresh the memory table when memory value change.
Note
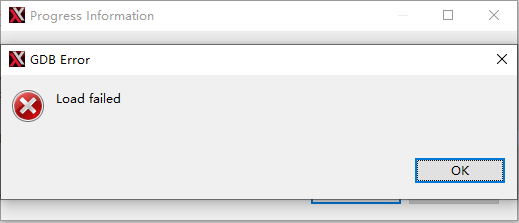
If the flowing GDB Error happens, reset MCU or repower the MCU board.
In the Linux environment, the operation steps are the same.
Using xt-gdb to Debug the Program
Open a command prompt window, and change the directory to
C:\Program Files (x86)\Tensilica\Xtensa OCD Daemon 14.08Run
xt-ocd -c topology.xml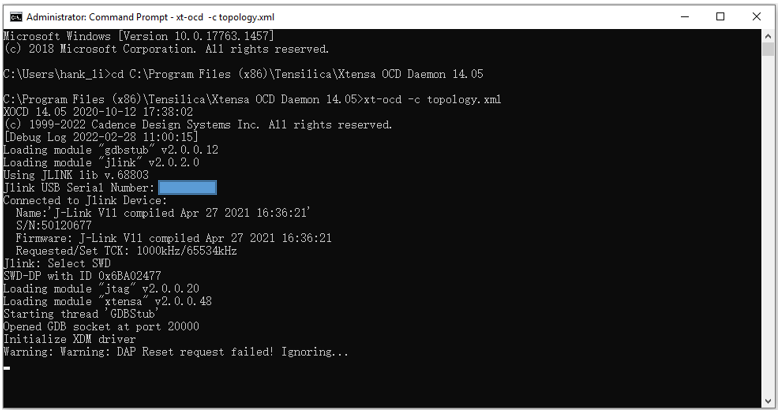
Note
Some warning messages are expected and can be ignored. If you receive an error initializing the XDM driver, you may need to initialize and start the DSP core before debugging. Under <dsp_sdk>\project (or auto_ws)\project_dsp\bin\HIFI5_PROD_1123_asic_UPG\Release, there is a project_dsp file.
Copy it to
C:\usr\xtensa\XtDevTools\install\tools\RI-2021.8 -win32\XtensaTools\binfolder.Open a Command Prompt window, and change the directory to
C:\usr\xtensa\XtDevTools\install\tools\RI-2021.8-win32\XtensaTools\bin. CMD for CALL0 configuration as follows:xt-gdb --xtensa-core=HIFI5_PROD_1123_asic_UPG project_dsp target remote localhost:20000 reset load
Now, you can start debug as you like. Here are some debug tips:
If the debug port cannot be connected all the time, it may be because the SWD port is closed (SWD port is used as normal GPIO). Enter the command
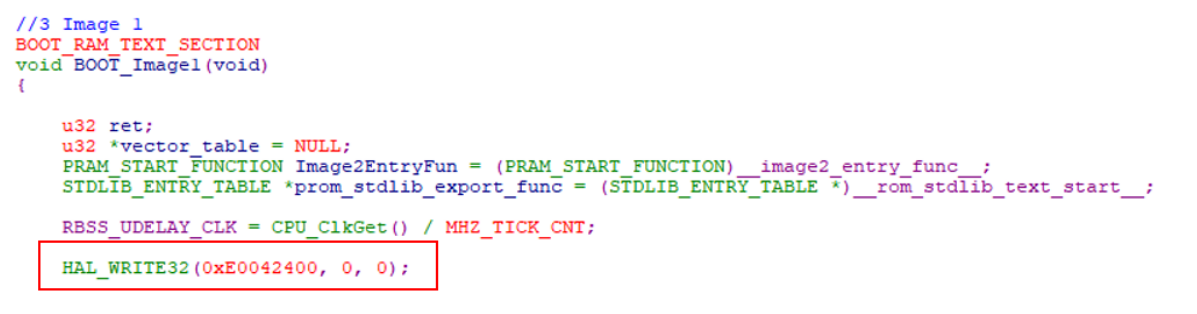
DW 4100C9F4to check SWD enable register via Realtek Tracetool. If the output log is4100C9F4: 00000008, it means the SWD port is closed. Open it with commandEW 4100C9F4 9.By default, KM4/KR4 will stop when you start debugging DSP. If you need to debug DSP with KM4/KR4 at running status, you have to change a register value in KM4 bootloader:
component/soc/amebalite/bootloader/bootloader_km4.c). Add the code in the red box at the corresponding position inBOOT_Image1()function:HAL_WRITE32(0xE0042400, 0, 0);
By default, when compiling DSP project, the corresponding disassembly will not be generated. If disassembly is required, you need to enable it in the post-processing script (
<dsp_sdk>project/img_utility/code_analyze.py): Set ENABLE_Disassembler to 1. The generated ASM file is<dsp_sdk>projectimageproject_dsp.asm.For Linux, the debug steps are the same. Pay attention to the path of the executable file. We recommend adding these to PATH:
/opt/Tensilica/xocd-14.08
/opt/xtensa/XtDevTools/install/tools/RI-2021.8-linux/XtensaTools/bin
If you use the
auto_build.shto build the project rather than Xplorer, you can file the project_dsp elf file in:<dsp_sdk>/auto_ws/project_dsp/bin/<configuration_name>/Release
For more debug guide, refer to xtensa_debug_guide.pdf and gnu_gdb_ug.pdf.