DSP ISS Simulation
Using the Instruction Set Simulator (ISS) for program analysis (profile) can help developers quickly locate performance bottlenecks in the performance tuning phase, thus optimizing the algorithm architecture.
Special reminder:
IPC communication is not supported, only single DSP simulation is available
The pure Computing Power of ISS simulation is basically as same as the real chip (for example, the data/code is in the cache). The memory characteristics of Cache and DTCM are obtained from the configuration to ensure ISS accuracy. However, since the system memory only supports parameters of PSRAM or SRAM, the ISS system memory model can only be configured as PSRAM or SRAM. Differences in memory models can introduce performance errors. According to different program characteristics, the simulation error is generally within 10%, and the maximum is about 20%.
Because most Xplorer licenses only support cycle accuracy simulation, when perform large project simulation, the simulation process will be relatively long. (You can firstly run a quick simulation to verify whether the simulation process is correct or not)
It is recommended to use GUI interface for simulation. If Xplorer is installed on a Linux server, you can open the X11 remote GUI of the server for use. The simulation parameters of SRAM and PSRAM are as follows: (By default, code/data are in PSRAM)
Item |
SRAM read |
SRAM write |
PSRAM read |
PSRAM write |
|---|---|---|---|---|
Memory Waitstates (cycles) |
16 |
2 |
28 |
28 |
Repeat Block Waitstates (cycles) |
2 |
2 |
8 |
8 |
Compiling Project
Modify the content of the LSP specs file (
<dsp sdk>\project\RTK_LSP\RI-2021.8\HIFI5_PROD_1123_asic_UPG\RTK_LSP\specs)*startfile: crt1-sim%O%s crti%O%s crtbegin%O%s _sharedvectors%O%s _vectors%O%s *endfile: crtend%O%s crtn%O%s *lib: -lc -lsim -lc -lhandler-reset -lhandlers-sim -lhal -lc
Edit the code and add the
exit()simulation exit function, for example:#include <xtensa/sim.h> ... int main() { ... // xt_iss_client_command("isa_profile", "enable"); // xt_profile_enable(); // "Start with counting off" Option app_example(); // xt_profile_disable(); exit(1); ... }
Recompile the project:

Simulation Configuration and Start
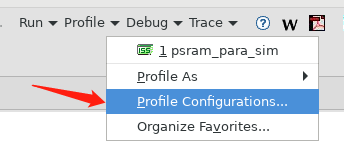
Press on the toolbar:
Rename the simulation task name according to your needs, and check the required functions in the Profiling Mode Options column.
Among them, Enable ISA profiling needs to be checked. Start with counting off with the prompt function can control the start and end position of the program segment that needs to count profile information, otherwise it will count all the codes from power on to
exit().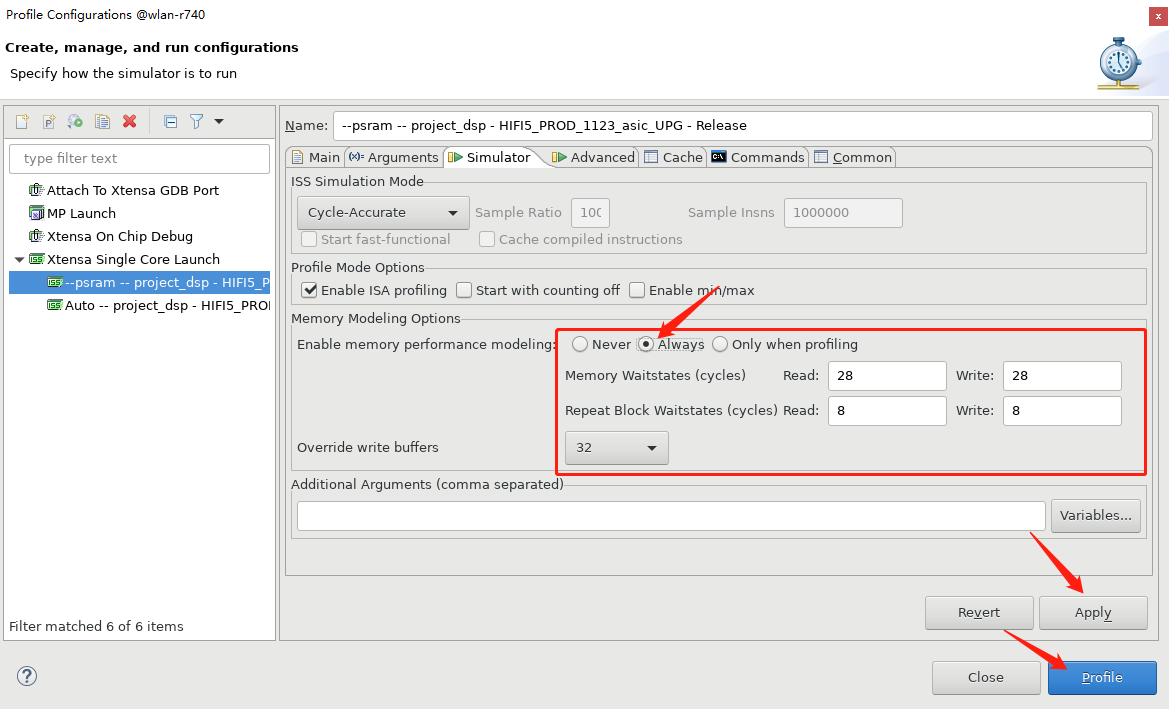
Click Apply and Profile to start the simulation.
Note that the Start with counting off option prompt window in the picture below is wrong (without the final “s”).
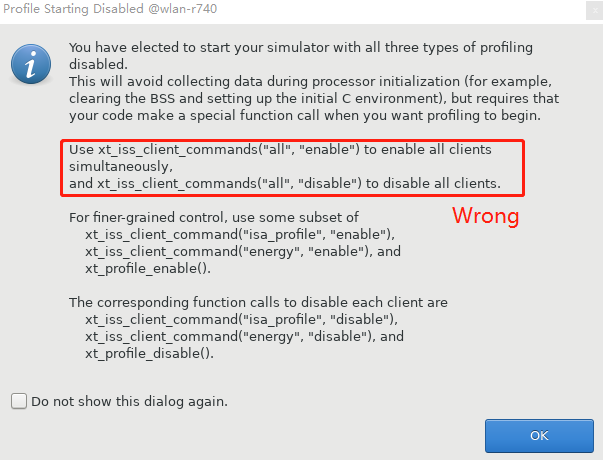
It should be:
xt_iss_client_command("all", "enable")
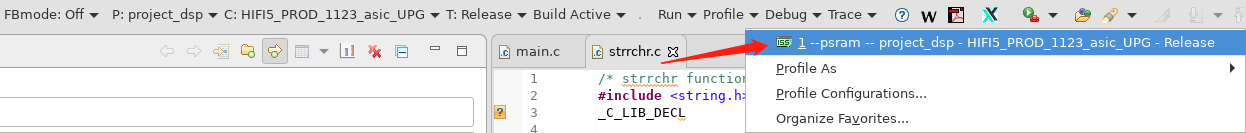
You can also click the setting in the figure below to start simulation. Note that you cannot directly click the profile button in the toolbar, otherwise there is no memory delay model by default.
There are various statistical results in the tab bar of the simulation window:

CMD Simulation
After the simulation is completed, you can click Console below to view the Xplorer simulation instructions, such as:
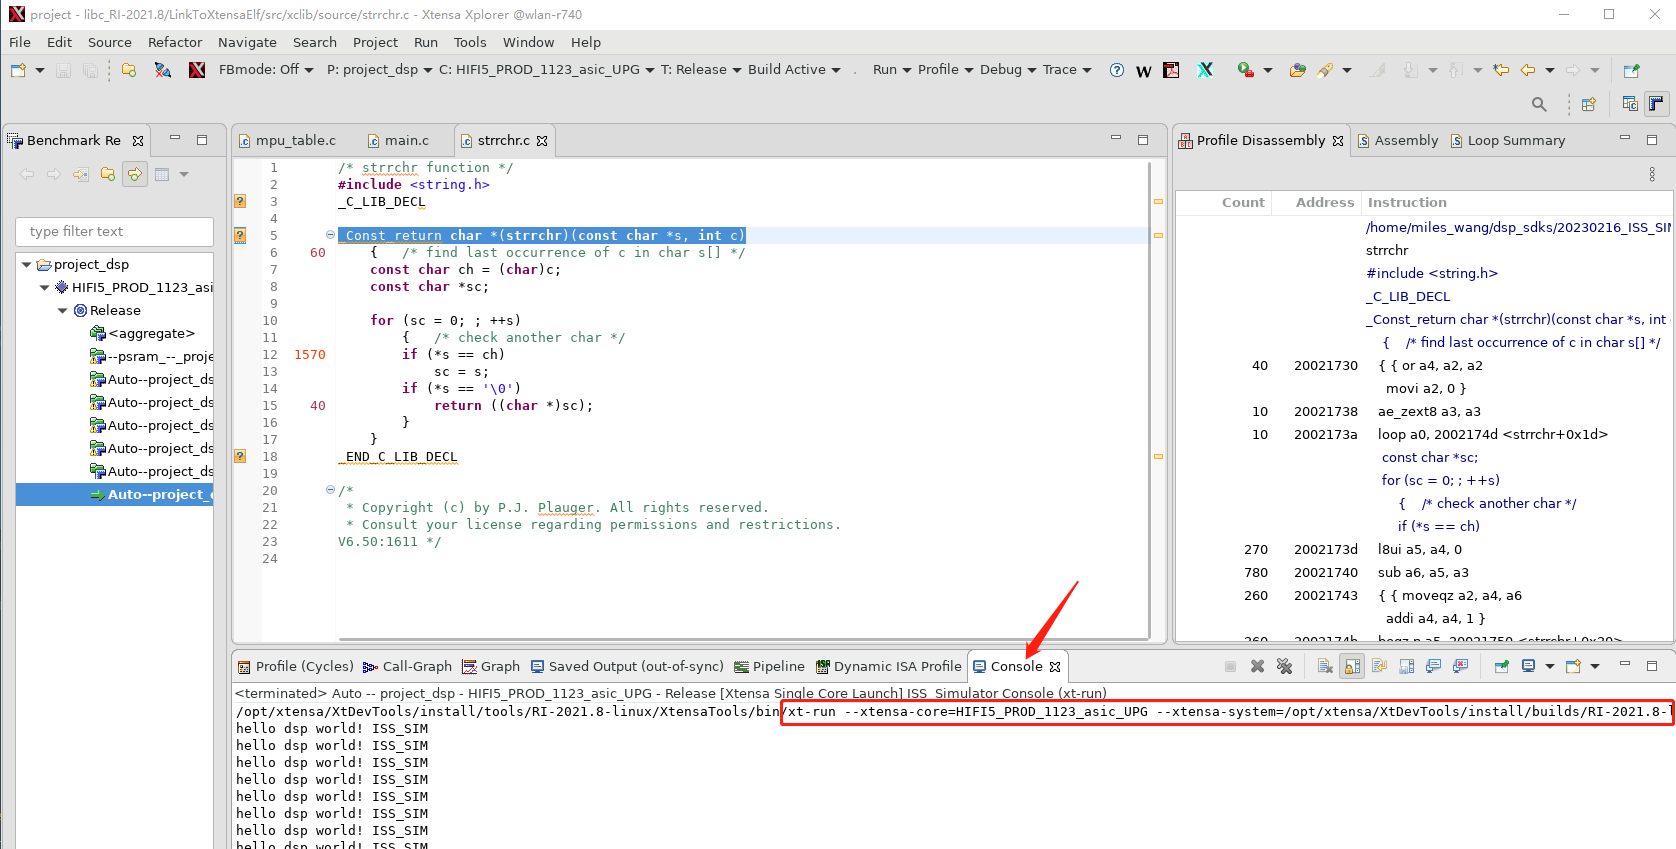
Save this command, for example:
/opt/xtensa/XtDevTools/install/tools/RI-2021.8-linux/XtensaTools/bin/xt-run --xtensa-core=HIFI5_PROD_1123_asic_UPG --xtensa-system=/opt/xtensa/XtDevTools/install/builds/RI-2021.8-linux/HIFI5_PROD_1123_asic_UPG/config --xtensa-params= --console --mem_model --wbsize=32 --mlatency=28 --blockrepeat=8 --write_delay=28 --write_repeat=8 --summary --client=<dsp sdk>/project/project_dsp/bin/HIFI5_PROD_1123_asic_UPG/Release/_gen_d/profile/--psram_--_project_dsp_-_HIFI5_PROD_1123_asic_UPG_-_Release/p_10/iss.clientcmds --vector=1 --alt_reset_vec=0x60301000 <dsp sdk>/project/project_dsp/bin/HIFI5_PROD_1123_asic_UPG/Release/project_dsp
You can use the above command for simulation. But it should be adjusted according to the actual project configuration and path. Note that if you use the auto_build.sh script to compile the project_dsp on linux, you need to modify the xt-run command according to the actual situation. For example, auto_build.sh will copy the project to the <dsp sdk>/auto_ws directory and then compile it. The last parameter in CMD (/home/miles_wang/dsp_sdks/20230216_ISS_SIM/dsp/project/project_dsp/bin/HIFI5_PROD_1123_asic_UPG/Release/project_dsp) needs to be modified accordingly.
Profile with RTOS Considerations
At present, the profile method provided by Xplorer is not perfect for handling exceptions and interrupts function calls. Generally, algorithm tuning can also be independent of the RTOS system. Therefore, Cadence does not recommend profiling in RTOS system.
If users have special requirements: profile must be performed in the RTOS system, we have the following suggestions:
Prevents context switches and servicing of ISRs during profiling.
Before entering the profiling statistics section, complete a lazy switch. Because the task switching of RTOS does not change the co-processor register. A co-processor register exception will only be generated when the task uses these DSP registers.
Examples are as follows:
void profiling_task(void)
{
int start, end;
vTaskEnterCritical();
co_processor_func(test_array); // this function uses DSP co-processor registers  start = xthal_get_ccount();
xt_iss_client_command("isa_profile", "enable");
xt_profile_enable();
for (int i = 0; i < 1000; ++i) {
co_processor_func (test_array);
}
xt_profile_disable ();
end = xthal_get_ccount();
vTaskExitCritical();
printf("%d cycles\n", end-start);  // output: 314313 cycles
exit(1);
}
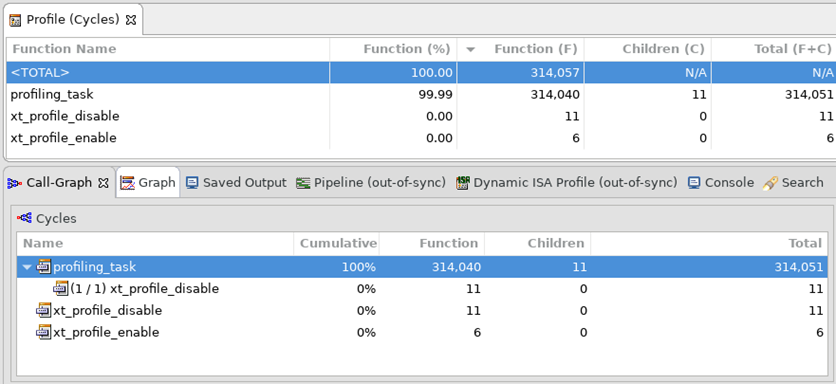
The result of profiling is as expected:
If we cancel the first call of co_processor_func(), you will find that some exception handlers have appeared. Xplorer will have problems with the statistics of these handles:
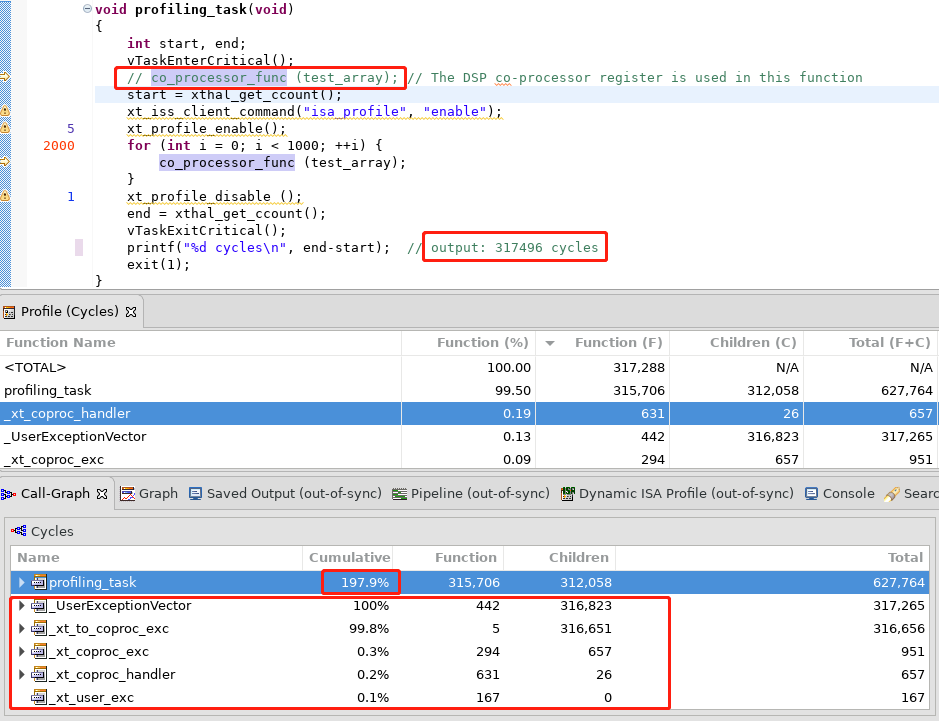
Profile (Cycles) table is correct, but in the Call-Graph table statistical error occurred.
Reference Document
For the specific ISS simulation method, refer to the Xtensa document (inst_set_sim_ug.pdf) in the Xplorer installation directory.
For the profiling result analysis, refer to gnu_profiler_ug.pdf.